Ethics statement
The TEDDY study obtained written informed consent for all study participants from a parent or primary caretaker, separately, for genetic screening and participation in the prospective follow-up. The study was approved by local US Institutional Review Boards (IRBs) and European Ethics Committee Boards as follows: Colorado’s Colorado Multiple IRB, Georgia’s Medical College of Georgia Human Assurance Committee (2004–2010), Georgia Health Sciences University Human Assurance Committee (2011–2012), Georgia Regents University IRB (2013–2015), Augusta University IRB (2015–present), Florida’s University of Florida Health Center IRB, Washington state’s Washington State IRB (2004–2012) and Western IRB (2013–present), Finland’s Ethics Committee of the Hospital District of Southwest Finland, Germany’s Bayerischen Landesärztekammer (Bavarian Medical Association) Ethics Committee, Sweden’s Regional Ethics Board in Lund, Section 2 (2004–2012) and Lund University Committee for Continuing Ethical Review (2013–present). The study is monitored by an External Advisory Board formed by the National Institutes of Health (NIH).
Study population and design
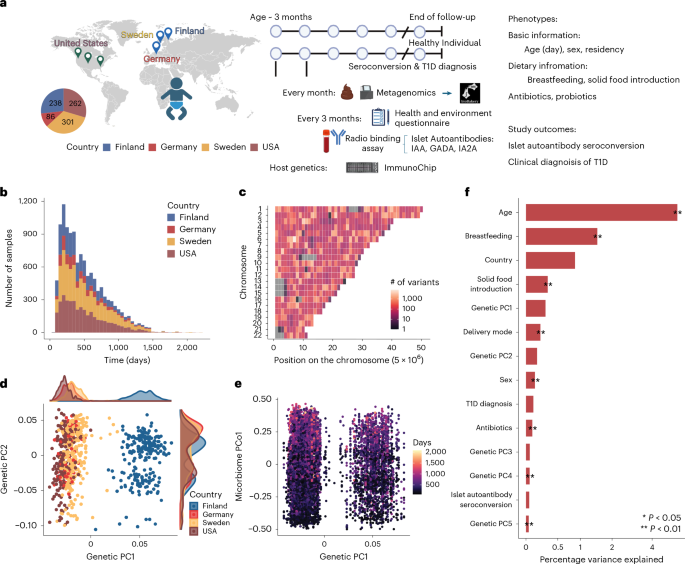
The TEDDY study is a prospective cohort study funded by the NIH aimed at identifying environmental causes of T1D. Detailed study design and methods have been previously published15,33,47. Between September 2004 and February 2010, the study screened 424,788 newborns who were younger than 4 months. Among them, 21,589 had HLA genotypes associated with an increased risk of T1D. The parents of 8,676 infants consented to participate in the follow-up study. The TEDDY study involves six clinical research centres: three in the United States (Colorado, Georgia/Florida and Washington) and three in Europe (Finland, Germany and Sweden). Eligible HLA genotypes differed between participants from the general population (four haplogenotypes, DR3/4, DR4/4, DR4/8 and DR3/3, with HLA-DRB1*04:03 as an exclusion allele) and those with a first-degree relative with T1D (nine haplogenotypes, DR3/4, DR4/4, DR4/8, DR3/3, DR4/4b, DR4/1, DR4/13, DR4/9 and DR3/9, ensuring broad HLA diversity)47. Children are followed from 3 months to 15 years of age, with study visits every 3 months until 4 years of age and every 3 or 6 months thereafter depending on autoantibody status. Sex was recorded at enrolment based on parental report for all participants; gender was not collected.
Our analysis included data from two nested case–control studies within the TEDDY cohort17. Controls were sampled using a risk-set approach17. A risk set is defined as the set of individuals who are at risk of the outcome at the specific time point when a case event occurs48. In this study, each risk set was operationalized as an event–time-matched stratum containing one case of persistent, confirmed IA or T1D and one control who remained free of IA or T1D at the same follow-up time (±45 days)17. This approach ensured a representative sample of person–time accrued during follow-up and allowed for a direct estimation of the incidence rate ratio. Controls were matched by clinical centre, sex and family history of T1D to control for regional, genetic and data-handling differences. The final analytical dataset consisted of 12,151 metagenomes from 887 individuals, including 403 female and 484 male participants. For analyses incorporating genetic data, we included 877 genotyped individuals. To derive microbiome maturational patterns through trajectory analysis, we used a subset of 594 individuals, excluding genetic outliers and those with fewer than four metagenomic samples.
DIABIMMUNE three-country cohort
The DIABIMMUNE three-country cohort included 212 infants recruited from Finland (n = 71), Estonia (n = 71) and Russia (n = 70), countries with substantial differences in T1D and allergy incidence. Infants were selected to have comparable HLA-conferred genetic risk for T1D and were matched by sex. Monthly stool samples were collected during the first 3 years of life, together with clinical assessments and questionnaire-based information on breastfeeding, diet, allergies, infections, family history and medication use24. We included 785 stool samples with repeated measures generated by whole-genome shotgun sequencing from these 212 infants to characterize the gut microbiome. The study was conducted in accordance with the Declaration of Helsinki and approved by the local ethical committees of the participating hospitals, with written informed consent obtained from the parents or study participants before sample collection.
Blood and faecal sample collection and preprocessing
Blood samples were obtained every 3 months until 4 years of age and biannually thereafter for the analysis of IAs (insulin, glutamic acid decarboxylase (GAD) and insulinoma antigen-2 autoantibodies). Whole blood was drawn into a syringe and transferred into a serum separation tube, allowed to clot at room temperature and centrifuged (800g, 4 °C, 20 min) to separate serum from the clot. Stool samples were collected monthly from 3–48 months of age, every 3 months thereafter until 10 years of age, and biannually subsequently following standardized TEDDY sample collection protocols; collection ceased in August 2018. Children who remained antibody-negative after 4 years of age were encouraged to submit samples four times annually despite the transition to a biannual visit schedule. Samples were shipped at ambient temperature or +4 °C with guaranteed delivery within 24 h to the National Institute of Diabetes and Digestive and Kidney Diseases (NIDDK) repository (US participants) or to the affiliated clinical centre (European participants), which sent monthly bulk shipments of frozen stool to the repository. Full protocols are available in the TEDDY Manual of Operations (https://repository.niddk.nih.gov/studies/teddy/).
Serum islet autoantibody measurements
Serum IAs were measured by radio-binding assays as previously described49. Samples were collected longitudinally according to the TEDDY follow-up schedule (every 3 months from 3–48 months of age, and every 3 or 6 months thereafter depending on autoantibody status). Glutamate decarboxylase autoantibodies (GADA), insulin autoantibodies (IAA) and islet antigen-2 autoantibodies (IA-2A) were measured in two TEDDY reference laboratories according to the location of the clinical centre (the Barbara Davis Center for Childhood Diabetes for US centres and the University of Bristol for European centres). From February 2010, harmonized assays were used for GADA and IA-2A in both laboratories, whereas IAA continued to be measured with the original TEDDY assay. All samples testing positive in one reference laboratory, together with 5% of negative samples, were re-tested in the other laboratory and were considered confirmed only if concordant. Positivity was determined against laboratory-specific thresholds; results for GADA and IA-2A are expressed in DK U ml⁻1 and those for IAA as an index.
Autoimmunity and diagnosis of type 1 diabetes
In this study, persistent autoimmunity was defined as positivity for IAs in two consecutive visits. Positive for IAs was defined as positive for at least one IA in two reference laboratories on at least two consecutive visits. The date of seroconversion (time to first autoantibody) was defined as the collection date of the first sample testing positive. T1D was defined according to the American Diabetes Association criteria for diagnosis50. This classification is based on pathogenesis rather than the requirement for insulin therapy.
Shotgun metagenomic sequencing and initial bioinformatics
Samples were metagenomically sequenced as one library each multiplexed through Illumina HiSeq 2000 machines using a 2 × 100-bp paired-end read protocol, and all downstream processing was conducted on paired-end reads. A minimum DNA input of 20 ng was required for whole-genome shotgun library preparation. Sequencing runs were considered passing if >60% of reads passed Illumina quality filtering, with a target sequencing depth of 1 Gb per sample and a minimum acceptable threshold of ~500 Mb when necessary. Samples failing to meet these criteria or yielding insufficient high-quality reads were excluded.
Raw FASTQ files generated by Casava v.1.8.2 (Illumina) were adaptor-trimmed with cutadapt v.1.9dev2, quality-trimmed with Trim Galore v.0.2.8 (Babraham Bioinformatics) and de-replicated and low-complexity-filtered with PRINSEQ v.0.20.5. Host and non-bacterial reads were removed using Bowtie2 v.2.2.3 (–end-to-end –sensitive) by alignment against a reference database derived from the NCBI whole-genome sequencing archive (March 2015 release), including bacterial, viral, human and vector genomes; human reads were filtered using GRCh38 (hg38), and reads whose best alignment was non-bacterial were excluded. Default parameters were used unless otherwise specified. Non-default parameters were: Trim Galore/cutadapt, -q 20, –stringency 6, –length 50 and –retain_unpaired with –length_1 51 and –length_2 51; PRINSEQ, -derep 12, -lc_method dust, -lc_threshold 5, -trim_ns_left 1, -trim_ns_right 1 and -no_qual_header; Bowtie2, –no-unal, –no-sq and –no-head.
Microbial taxonomical and functional profiling
Taxonomic and functional profiling were performed using the standardized bioBakery 2.0 workflow, consistent with previous TEDDY microbiome studies8, to ensure comparability across the TEDDY metagenomic resource. Taxonomic profiling was conducted using MetaPhlAn 2 (v.2.6.0)51 with default settings, which employs a library of clade-specific markers to quantify bacterial and archaeal communities at the species level.
Functional profiling was carried out using HUMAnN 2 (v.0.9.4)52 to characterize community pathway and gene-family abundance. For each metagenome, HUMAnN 2 constructs a sample-specific reference database from the pangenomes53 of species detected by MetaPhlAn 2, maps sample reads against this database to quantify gene abundance in a species-stratified manner, and subjects unmapped reads to a translated search against UniRef9054 to capture taxonomically unclassified but functionally distinct gene families. Pathway abundances were reconstructed from gene families annotated to metabolic reactions using MetaCyc definitions55 and enzyme abundance (level-4 EC categories) by summing gene families annotated to each EC number using UniRef90-EC annotations from UniProt56. Viral functional content was not analysed, as the underlying ChocoPhlAn and UniRef reference databases contain limited viral content.
Genotype analysis
TEDDY children were genotyped by the Center for Public Health Genomics at the University of Virginia using the Illumina ImmunoChip, a custom array of SNPs from regions robustly associated with autoimmune disease, selected for 12 autoimmune diseases by the ImmunoChip Consortium57,58. Genotype quality control (QC) was performed using KING (v.2.3.0) and PLINK (v.1.90b7). KING –autoQC was used for sample-level, SNP-level QC (95% call rate) and sex QC. In PLINK, SNPs with a minor allele frequency of less than 0.05 were removed, as were SNPs that failed the Hardy–Weinberg test (P < 0.001). SNPs in linkage disequilibrium (window 50, step 5, R2 = 0.2) were pruned before calculating heterozygosity, and individuals outside μ ± 3σ were removed. The proportion of Identity-by-descent was calculated to identify related individuals; for pairs with PI_HAT > 0.2, the member with higher missingness was removed. PCA was performed, and the top five PCs were used for downstream analysis. Individuals with PC scores below Q1 − 1.5 × interquartile range or above Q3 + 1.5 × interquartile range were considered genetic outliers and removed. BEDTools (v.2.31.1) was used to identify the nearest gene to each SNP using GRCh37.
Covariable measurement
Metadata were collected using validated questionnaires47. Information about mothers, pregnancy and birth was collected by questionnaire at the 3-month clinic visit and included mode of birth, 5-min Apgar score, pregnancy complications, maternal diabetes, gestational age, and maternal medication use during pregnancy. Infant diet was assessed through mailed questionnaires completed before the first clinic visit, structured interviews at each clinic visit, and records kept by the mother in the TEDDY Book, covering breastfeeding duration, age at introduction of foods, infant formula type, drinking water source, elimination diets, and dietary supplements. A 24-h dietary recall was obtained at the first 3-month clinic visit to aid caretaker training and to capture the infant’s diet at that age. Primary caretakers were trained at the 3-month visit to keep 3-day food records at 3-month intervals during the first year and biannually thereafter, reviewed with trained study personnel at each visit.
Diversity and ordination-based analyses
The structure of the gut microbiome was examined using the vegan package (v.2.5.6). The Bray–Curtis distances between samples were calculated based on their MetaPhlAn 2 profiles using the vegan::vegdist(). To measure both species richness and evenness within a sample, the Shannon diversity index was computed using the vegan::diversity() (Extended Data Fig. 3). PCoA was performed based on the Bray–Curtis distances using the ape::pcoa() from the ape package (v.5.4.1). Additionally, PERMANOVA was performed on Bray–Curtis distances using vegan::adonis2(). To respect the non-independence of repeated longitudinal samples, we used a restricted permutation design in which whole individuals were treated as the exchangeable unit: individuals were freely permuted, while no permutation was performed within individuals. The scheme is appropriate for testing between-subject covariates such as genetic PCs and country of origin, as it keeps repeated measures intact and prevents anti-conservative inflation of significance from pseudo-replication. Significance was assessed using 999 permutations. The stability of the gut microbiome over time was evaluated by calculating the Bray–Curtis distance from the initial time point for each individual.
Association between host genetic variation and microbiome composition
Mantel and Procrustes analyses were performed within predefined age intervals (<1, 1–2, 2–3, 3–4, 4–5 and 5–6 years). To ensure sample independence, only the earliest stool sample from each participant within each age interval was retained. Participants without a microbiome sample in a given interval were excluded from that analysis. Microbiome composition was represented by species-level relative abundance profiles using Bray–Curtis dissimilarities, whereas host genetic variation was represented by Euclidean distances calculated from standardized top five genome-wide genotype-derived PCs (PC1–PC5).
Mantel tests were used to evaluate the correspondence between microbiome and genetic distance matrices using Spearman rank correlations with significance assessed by 999 permutations. For Procrustes analysis, PCoA was performed on the Bray–Curtis distance matrix, and the top five microbiome coordinate axes were compared with PC1–PC5 using the vegan package in R. Statistical significance was evaluated using the PROTEST permutation procedure with 999 permutations.
Microbiome maturational pattern identification
The maturational patterns were identified using a trajectory-clustering algorithm implemented in the R package traj (v.2.0.1), which employs the Bray–Curtis distance to quantify changes in gut microbial composition from baseline across subsequent visits during the initial 800-day period. Baseline was defined as the earliest available stool sample, which reflects a relatively consistent microbial state before major environmental exposures and dietary diversification. Traj implements a three-step procedure to identify clusters of individual longitudinal trajectories. This procedure involves (1) computing a number of ‘measures of change’ capturing various features of the trajectories; (2) using a PCA-based dimension reduction algorithm to select a subset of measures; and (3) using the k-means clustering algorithm to identify clusters of trajectories.
The optimal number of maturational patterns was determined by balancing the results from various diagnostic metrics, including the Calinski–Harabasz Index59, the gap statistic60 and the elbow method (Supplementary Fig. 3), The elbow plot showed a marked reduction in slope around k = 3, beyond which additional clusters yielded diminishing returns. Although the Calinski–Harabasz Index favoured k = 2, the gap statistic indicated that this solution was under-separated. Considering these diagnostics together, as well as statistical efficiency for downstream association analyses, we selected k = 3 as the most parsimonious and robust solution.
Estimation of relative risk of type 1 diabetes
Due to the risk-set sampling design of this study, we were able to estimate RRs61,62 for a composite end point encompassing either the development of IAs (seroconversion) or a clinical diagnosis of T1D, as well as for each of these event types individually, by comparing a microbiome maturation pattern to Early Matured pattern. Utilizing the equivalence between the partial log-likelihood of the Cox proportional hazards model and the log-likelihood of conditional logistic regression63, RR estimation was conducted using the R package survival (v.3.5-5), with the model stratified by risk sets. The primary exposures of interest were the maturational patterns of the gut microbiome. The models were adjusted for potential confounding factors known to influence the risk of seroconversion and T1D. These factors included the matching variables in the case–control design (clinical centre, sex and family history of T1D) as well as additional covariates, including genetic PCs, interactions between clusters and PCs, delivery mode, breastfeeding, antibiotic use, probiotic use and timing of the introduction of solid foods. We applied methods from Langholz et al.64 and Samuelsen et al.65 to calculate adjusted cumulative incidence curves extrapolated to the full TEDDY cohort from multivariable models incorporating sampling weights to account for risk-set sampling in the nested case–control design.
Partitioning of variance in T1D risk
To assess the relative contribution of different components to T1D risk, we quantified the variance explained using a likelihood-based pseudo-R2, which reflects the proportion of variation in the model log-likelihood explained by the included predictors. We compared pseudo-R2 values across a set of nested models designed to partition the contribution of each component. The baseline model (M0) included demographic and clinical covariates (for example, sex, clinical centre and delivery mode). M1 added the microbiome maturation pattern; M2 additionally incorporated host genetic PCs (PC1–PC5); and M3 further included interaction terms between the genetic PCs and the maturation pattern. Differences in pseudo-R2 between models were used to estimate the incremental variance explained by each component.
Taxonomic and functional feature association analyses
For a microbial species or a MetaCyc pathway to qualify for downstream analyses, it needed to be present in at least 10% of samples with a minimum detectable relative abundance of 0.0002. The criterion for EC numbers was that at least 10% of samples with that feature were detectable at a minimum relative abundance of 0.00002. Additionally, we removed functional features with high correlations to others by selecting the most abundant feature from each cluster as its representative.
We employed linear mixed models in MaAsLin 2 (ref. 25), using gut microbiome features as dependent variables and microbiome maturational patterns as the independent variable. Individual IDs were incorporated as random effects, whereas clinical centre, sex, delivery mode, antibiotic use, introduction of solid foods and breastfeeding status were included as fixed effects. This approach allowed us to identify microbial species with differential abundance across maturational patterns within each 100-day interval. The false discovery rate (FDR)-adjusted P values (q) were calculated using the Benjamini–Hochberg method
Gene set enrichment analysis
To characterize further the biological processes associated with genetic PCs, we performed a SNP-level pre-ranked Gene Ontology (GO) term66 enrichment analysis in which SNPs were ranked by their loading values for each PC. Significance was assessed by permuting SNP labels within SNP sets, with FDR control. This directly tests whether the observed concentration of high-loading SNPs within a given ontology is greater than expected by chance, given the fixed PC loadings. We adopted the definition of ‘informative GO terms’ from previous studies67 to curate a list of GO terms as input for the enrichment analysis. A GO term was defined as informative if it contained more than 20 genes, and all its child terms contained fewer than 20 genes. The enrichment analysis used the ranking of SNP loading factors for each genetic PC. Enrichment scores were calculated using the fgsea R package with 1,000 permutations against curated GO terms, and terms with q < 0.10 were considered significantly enriched. Visualization was generated using fgsea (v.1.22.0) and ggplot2 (v.3.3.6).
Genetic and microbiome association analyses over time
We used the following linear mixed-effects model with random slopes to identify microbiome features that were associated with genetic features:
microbiome ~ genetics + age + genetics:age + clinical centre + (1 + age | individual)
In this model, age refers to the child’s age in days at the time of stool collection. We include a random slope on age so that each individual can have their own microbiome developmental trajectory, which accommodates the substantial inter-individual heterogeneity characteristic of early-life microbiome maturation.
The genetic main effect estimates whether genetic variation is associated with baseline microbiome composition, independently of time. The genetics:age interaction term tests whether genetic background is associated with differences in the rate of microbiome change over time, rather than at a single time point. Thus, the interaction evaluates whether the slope of microbial development varies with genotype, after adjusting for clinical centre to account for geographic differences in environment and sampling.
Samples were subset into two age groups: infant samples collected before 18 months and toddler samples collected after. Models were run separately for these age groups because gut microbiome development up to three years may be non-linear. In each age group, species were included for modelling if they were present at >1% relative abundance in at least one sample among 25% or more participants. Similarly, pathways were included for modelling if they were present at >1 copy per million reads in at least one sample from 25% of individuals. Microbiome feature abundances were transformed using the formula:
log (abundance + ε)
where Ɛ is half of the minimum non-zero abundance of the microbiome feature of interest. For SNPs, minor homozygous alleles were included if they were present in >30 individuals per age group. Models were implemented using the lmerTest::lmer() function from lmerTest v.3.1-3, and an analysis of variance test was used to determine the significance of associations in the models. For PC-based models, the P values were adjusted using the Bonferroni correction methods. For SNP models, a P value of 5 × 10⁻⁸ was used as the threshold of significance.
Statistics and reproducibility
This study is an observational analysis of two nested case–control studies within the prospective TEDDY birth cohort; no experimental replication was performed, and all analyses were conducted on the full set of available samples meeting the quality criteria described above. No statistical method was used to predetermine sample size; sample size was determined by the number of eligible case–control sets available within the existing TEDDY nested case–control design.
Data were excluded as follows: metagenomic samples whose sequencing run failed quality criteria (<60% of reads passing Illumina quality filtering) or that yielded insufficient high-quality reads; individuals failing genotype QC (call rate <95%, heterozygosity outside μ ± 3σ or genetic outlier status by PCs) and, for related pairs (PI_HAT > 0.2), the member with higher missingness; individuals with fewer than four metagenomic samples for trajectory analyses; individuals without a stool sample in a given age interval for the corresponding interval-specific analysis; and microbial features not meeting the prevalence and abundance thresholds described above.
The experiments were not randomized; exposure status was observational and controls were selected by risk-set sampling matched on clinical centre, sex and family history of type 1 diabetes rather than by randomization. The Investigators were not blinded to allocation during experiments and outcome assessment.
All analyses were performed in R v.4.2.3. Microbiome maturational patterns were derived by trajectory-based clustering of longitudinal taxonomic profiles; community-level comparisons used distance-based ordination and PERMANOVA; feature-level associations between microbiome features and maturational patterns, host genetic variation and covariates were tested using linear mixed models implemented in MaAsLin 2, with individual identifiers as random effects; and relative risks of type 1 diabetes were estimated within the matched case–control sets. Full model specifications, including covariates and random-effects structures, are given in the corresponding Methods subsections. All tests were two-sided unless otherwise stated. Multiple testing was controlled by the Benjamini–Hochberg FDR, except for PC-based linear mixed models (Bonferroni) and SNP-level models (P < 5 × 10⁻9). Permutation-based tests used 999 permutations unless otherwise specified.
Reproducibility was addressed in three ways. All 12,151 metagenomes from 887 children were processed through a single identical bioinformatic pipeline, with software versions, reference databases and analytical parameters reported above. The trajectory-clustering framework was applied independently to the DIABIMMUNE three-country cohort, in which qualitatively similar maturational patterns were recovered. The primary association between maturational pattern and T1D risk was examined in sensitivity analyses, including sex-stratified models and models with additional covariate adjustment.
Reporting summary
Further information on research design is available in the Nature Portfolio Reporting Summary linked to this article.