Mice
C57BL/6, P14 TCR-transgenic (Tg)45, pmel TCR-Tg46 and Rosa26-Cas9 knock-in47 mice were purchased from the Jackson Laboratory. Human CD19 CAR-Tg mice were provided by T. Geiger36. We crossed Rosa26-Cas9 knock-in mice with P14, pmel or human CD19 (hCD19) CAR-Tg mice to express Cas9 in antigen-specific CD8+ T cells. The Cas9-expressing mice were fully backcrossed to the C57BL/6 background. Sex-matched (male or female) mice were used at 7–12 weeks of age unless otherwise noted and assigned randomly to control and experimental groups. All mice were maintained in a specific pathogen-free facility in the Animal Resource Center at St. Jude Children’s Research Hospital. Mice were kept with 12 h–12 h light–dark cycles that coincide with daylight in Memphis, TN, USA. The St. Jude Children’s Research Hospital Animal Resource Center housing facility was maintained at 30–70 % humidity and 20–25 °C. Animal protocols were approved by and performed in accordance with the Institutional Animal Care and Use Committee (IACUC) of St. Jude Children’s Research Hospital.
Cell lines
The Plat-E cell line was provided by Y.-C. Liu and cultured in Dulbecco’s modified essential medium (DMEM) (Gibco) supplemented with 10% (v/v) FBS and 1% (v/v) penicillin–streptomycin. B16-gp33 cell line was provided by B. Youngblood and the B16-hCD19 cell line was generated as described31. B16F10, BHK (CL-10), Vero (CCL-81), Jurkat (E6-1) and HEK293T cell lines were purchased from the American Type Culture Collection (ATCC). All tumour cell lines were cultured in RPMI 1640 medium (Gibco) supplemented with 10% (v/v) FBS and 1% (v/v) penicillin–streptomycin. No commonly misidentified cell lines were used in this study (International Cell Line Authentication Committee). Cell lines used in this study were not independently authenticated or tested for Mycoplasma contamination.
Naive T cell isolation and viral transduction
Naive Cas9-expressing P14, pmel or hCD19 CAR-Tg cells were isolated from the spleen and peripheral lymph nodes of P14-Cas9, pmel-Cas9 and CAR-Tg-Cas9 mice using a naive CD8α+ T cell isolation kit (Miltenyi Biotec) according to the manufacturer’s instructions. Purified naive P14, pmel and hCD19 CAR-Tg T cells were activated in vitro for 20 h with 10 μg ml–1 anti-CD3 (145-2C11; Bio-X-Cell) and 5 μg ml–1 anti-CD28 (37.51; Bio-X-Cell) antibodies before viral transduction. Viral transduction was performed by spin-infection at 900g at 25 °C for 3 h with 10 μg ml–1 polybrene (Sigma-Aldrich), followed by 2 h rest at 37 °C and 5% CO2. After transduction, cells were cultured in T cell medium (Click’s medium (IrvineScientific) supplemented with 10% FBS, 55 μM 2-mercaptoethanol and 1× penicillin–streptomycin–l-glutamine (Gibco)) with recombinant human IL-2 (20 IU ml–1; National Cancer Institute or PeproTech), mouse IL-7 (12.5 ng ml–1; PeproTech) and IL-15 (25 ng ml–1; PeproTech) for 3 days. Transduced cells were sorted based on the expression of Ametrine or GFP (as indicated in the figure legends) using a Reflection cell sorter (iCyt) before adoptive transfer into recipient mice. sgRNAs were designed using an online tool (https://portals.broadinstitute.org/gppx/crispick/public), and the sgRNAs used in this study are listed in Supplementary Table 11. Unless otherwise indicated in the text, the guides used for targeting Zmynd8, ZMYND8 and Ep300 in all experiments were sgZmynd8.g2, sgZMYND8.g1 and sgEp300.g2, respectively. The retroviral sgRNA vector was previously described19,22. Retrovirus was produced by co-transfecting Plat-E cells with the core plasmid (sgRNA plasmid) and the packaging plasmid pCL-Eco (Addgene, #12371) and was collected 48 h after transfection. Co-deletion experiments were performed through double transduction of Cas9-expressing CD8+ T cells with Ametrine- and GFP-expressing retroviral vectors (Ametrine and GFP co-expression marked cells that had undergone successful dual transduction), followed by flow cytometry analysis.
Adoptive T cell transfer
For chronic LCMV infection, a total of 1 × 10⁴ retrovirus-transduced Cas9+ P14 CD8+ T cells were adoptively transferred intravenously into sex-matched Cas9-expressing recipient mice before infection to minimize the potential rejection. For tumour models, retrovirus-transduced Cas9+ P14, pmel or hCD19 CAR-Tg cells were adoptively transferred intravenously to the tumour-bearing mice on either day –1 (1 × 10⁶ cells per mouse) or day 7 (4 × 10⁶ per mouse) after tumour inoculation (as indicated in the figure legends). In the single-colour transfer system to assess antitumour effects, antigen-specific T cells transduced with sgNTC or the indicated sgRNAs (expressing the same fluorescent reporter protein) were transferred to separate hosts. In the dual-colour transfer system (for assessment of phenotypic alterations), cells transduced with the indicated sgRNAs marked by the expression of Ametrine, were mixed at a 1:1 ratio with those transduced with sgNTC labelled with GFP (spike), followed by adoptive transfer to the same host. To calculate fold changes in the dual-colour transfer system, the frequency of indicated population or geometric mean fluorescence intensity (gMFI) of indicated protein was calculated relative to spike (sgNTC) cells from the same host. Specifically, the proportion or gMFI of sgRNA-transduced cells was divided by the proportion or gMFI of spike cells and further normalized to the ratio of pre-transfer input samples. For the double knockout experiments, Cas9-expressing P14 cells co-transduced with sgNTC or sgZmynd8 (both GFP+)-expressing retrovirus together with sgNTC, sgStat5b, sgIl2ra, sgIl2rb or sgEp300 (all Ametrine+)-expressing retrovirus. Then, co-transduced Cas9+ P14 cells (all GFP+Ametrine+) were mixed at a 1:1 ratio with cells transduced with sgNTC (spike cells; Ametrine+) and co-transferred into the same Cas9+ mice, followed by LCMV Cl13 infection (dual-colour transfer system). The quantification of cell number was performed by calculating the numbers of indicated sgRNA-transduced cells and the sgNTC-transduced spike cells from the same LCMV Cl13-infected or tumour-bearing host, followed by normalization to the tumour weight in the tumour model.
LCMV Cl13 infection
LCMV Cl13 virus was grown in BHK-21 cells (ATCC, CCL-10), and viral titres were determined by plaque formation assay on Vero cells (ATCC, CCL-81). To induce chronic LCMV Cl13 infection, 2 × 10⁶ plaque-forming units (PFU) of LCMV Cl13 were injected intravenously post-adoptive transfer of P14 cells where noted. To quantify LCMV viral loads in serum and tissues of chronically infected mice, LCMV quantitative PCR (qPCR) assay was applied as previously described48. In brief, 10 mg liver and kidney samples were homogenized in the presence of lysis buffer (Buffer RLT (QIAGEN) supplemented with 1% 2-mercaptoethanol), and total RNA was isolated using the RNeasy Mini Kit (QIAGEN) according to the manufacturer’s instructions. For serum samples, RNA was extracted from 100 μl serum using RNeasy Micro Kit (QIAGEN). Then, 15 μl RNA was used in a 20 μl cDNA reverse transcription reaction with High-Capacity cDNA Reverse Transcription Kit (Thermo) and the GP-R primer shown below. cDNA from liver and kidney samples was diluted 200-fold, and cDNA from serum samples was diluted 5-fold before adding to Power SYBR Green Master Mix (Applied Biosystems) containing LCMV-specific new GP primers: GP-R (S pos. 970-991), GCAACTGCTGTGTTCCCGAAAC; and GP-F (S pos. 877-901): CATTCACCTGGACTTTGTCAGACTC.
Amplification was assessed using QuantStudio7 Flex Real-Time PCR System (Applied Biosystems). The samples from uninfected mice were used as negative control. The viral load was calculated using a known LCMV Cl13 stock (quantified by plaque formation assay) as a standard.
Secondary adoptive cell transfer assays
Cas9-expressing P14 cells transduced with sgNTC (Ametrine+) or sgZmynd8 (GFP+) were mixed at a 1:1 ratio and co-transferred into C57BL/6 mice, followed by infection with LCMV Cl13 on the same day. At 10 dpi, Texprog (Ly108+TIM-3−CX3CR1−), effector-like (Ly108−TIM-3+CD101−) or Texint (Ly108−CX3CR1+KLRG1−) populations among control (sgNTC) and ZMYND8-deficient (sgZmynd8) P14 cells in the spleen were purified by sorting. LCMV Cl13 infection-matched mice received co-transfer of a 1:1 mixture of control and ZMYND8-deficient Texprog cells (1 × 10⁵ each), effector-like cells (2.5 × 10⁵ each) or Texint cells (2.5 × 10⁵ each). The differentiation of each Tex subpopulation into various Tex subpopulations (as indicated in the figures and their legends) was examined on day 9 after secondary transfer (that is, at 19 dpi) by flow cytometry analysis.
In vivo administration of biologics in LCMV Cl13-infected mice
For PD-L1 blockade, IgG isotype control antibody (200 μg per mouse; clone LTF-2, Bio-X-Cell) or anti-mouse PD-L1 antibody (200 μg per mouse; clone 10 F.9G2, Bio-X-Cell) was administered intraperitoneally into LCMV Cl13-infected mice at 13, 16, 19, 22 and 25 dpi. For IL-2 therapy, PBS or recombinant human IL-2 (rhIL-2) (1.5 × 10⁴ IU per mouse; National Cancer Institute) was injected intraperitoneally into LCMV Cl13-infected mice once daily from 30–35 dpi for a total of 6 daily injections.
Tumour models and immunotherapeutic treatments
In the single-colour transfer system for tumour therapy assays, 5 × 10⁵ B16-gp33 or B16F10 melanoma cells were subcutaneously injected into the right flank of C57BL/6 mice. On days 7–10 after tumour inoculation (as indicated in the figures or their legends), mice bearing tumours of a similar size were randomly divided into treatment groups (5–8 mice per group). Then, Cas9-expressing P14 (for the treatment of B16-gp33 melanoma) or pmel (for the treatment of B16F10 melanoma) CD8+ T cells transduced with sgNTC or the indicated sgRNAs (with the same fluorescent reporter protein) were adoptively transferred (4 × 10⁶ cells per mouse) individually to tumour-bearing mice. For anti-PD-L1 treatment, the B16-gp33 tumour-bearing mice were treated with two intraperitoneal injections of anti-PD-L1 (200 μg per mouse; clone 10 F.9G2, Bio-X-Cell) or IgG isotype control antibody (200 μg per mouse; clone LTF-2, Bio-X-Cell) on days 15 and 18 after tumour inoculation. For IL-2 treatment, tumour-bearing mice were randomly divided into two groups on day 10 after tumour inoculation and intraperitoneally injected with either PBS or rhIL-2 (1 × 10⁵ IU per mouse, dissolved in PBS) every day and 5 times in total. For the tumour model shown in Extended Data Fig. 12a–c, retrovirus-transduced Cas9+ P14 cells (1 × 10⁶ cells per mouse) were adoptively transferred intravenously to the C57BL/6 mice one day before subcutaneous inoculation of B16-gp33 tumour cells (1 × 10⁶ per mouse). Mice were monitored for tumour growth; tumours were measured every 2 days with digital callipers and tumour volumes were calculated using the following formula: length × width × width × π/6. For all tumour growth curves, the graphs depict the growth curves of individual tumours (dotted lines) and the average tumour volumes (bold lines). To isolate intratumoural lymphocytes, tumours were collected on the indicated days after inoculation, excised, minced and digested with 1 mg ml−1 collagenase IV (LS004188, Worthington Biochemicals) and 200 U ml−1 DNase I (DN25-1G, Sigma-Aldrich) for 1 h at 37 °C and passed through 70-μm filters to remove undigested tumour tissues. Tumour-infiltrating lymphocytes (TILs) from B16-gp33 or B16-hCD19 melanoma were further isolated by density-gradient centrifugation over Percoll (17089101, Cytiva) at 2,500 rpm for 20 min at room temperature. Tumour size limits were approved to reach a maximum of 3,000 mm3 or ≤20% of body weight (whichever was lower) by the IACUC of St. Jude Children’s Research Hospital.
Flow cytometry
For analysis of surface markers, cells were stained in PBS (Gibco) containing 2% FBS. Surface proteins were stained for 30 min at 4 °C. For transcription factor staining, cells were stained for surface molecules and then fixed with 2% paraformaldehyde (Thermo Fisher Scientific) for 30 min at room temperature, followed by permeabilization with FOXP3/transcription factor staining buffer set, according to the manufacturer’s instructions (00-5523-00, eBioscience). Intracellular staining for cytokines was performed using BD CytoFix/CytoPerm fixation/permeabilization kit (554774, BD Biosciences) after stimulation with phorbol 12-myristate 13-acetate (PMA; Sigma-Aldrich) and ionomycin (Sigma-Aldrich) in the presence of monensin (GolgiStop, 554724, BD Bioscience) for 4 h. 7-AAD (A9400, 1:200, Sigma-Aldrich) or fixable viability dye (65-0865-14; 1:2,000, eBioscience) was used for dead-cell exclusion. The following antibodies from eBioscience were used: APC–anti-CD25 (PC61.5, 17-0251-82, 1:200); APC–anti-NKG2D (1D11, 17-5878-42, 1:200); APC–anti-perforin (eBioOMAK-D, 17-9392-80, 1:200); PE–anti-TOX (TXRX10, 12-6502-82, 1:100); PE–anti-CD101 (Moushi101, 12-1011-82, 1:200); PE/Cyanine7–anti-NKG2D (CX5, 25-5882-82, 1:200); PE/Cyanine7–anti-TIM-3 (RMT3-23, 25-5870-82, 1:400); PE/Cyanine7–anti-CD101 (Moushi101, 25-1011-82, 1:200); PE/Cyanine7–anti-KLRG1 (13F12F2, 25-9488-42, 1:200); PerCP-eFluor 710–anti-CD39 (24DMS1, 46-0391-82, 1:400); PerCP-eFluor 710–anti-GZMA (GzA-3G8.5, 46-5831-82, 1:200). The following antibodies from BioLegend were used: PE–anti-CD122 (5H4, 105906, 1:200); Alexa Fluor 700–anti-CD8α (53-6.7, 100730, 1:400); Brilliant Violet 785–anti-TCRβ (H57-597, 109249, 1:400); APC–anti-Ly108 (330-AJ, 134610, 1:400); APC–anti-CD122 (5H4, 105912, 1:200); Brilliant Violet 421–anti-TNF (MP6-XT22, 506328, 1:200); Brilliant Violet 421–anti-mouse/human KLRG1 (2F1/KLRG1, 138414, 1:200); APC/Cyanine7–anti-NK1.1 (PK136, 108724, 1:200); Brilliant Violet 711–anti-CD8 (53-6.7, 100748, 1:400); Brilliant Violet 711–anti-CD366 (TIM-3) (RMT3-23, 119727, 1:400); Brilliant Violet 421–anti-CX3CR1 (SA011F11, 149023, 1:400); Brilliant Violet 650–anti-CX3CR1 (SA011F11, 149033, 1:400); PE/Cyanine7–anti-mouse Ki-67 (16A8, 652426, 1:200); Alexa Fluor 647–anti-human/mouse GZMB (GB11, 515405, 1:100); PE–anti-IFNγ (XMG1.2, 505808, 1:200). FITC–anti-human CD279 (PD-1) (A17188B, 621612, 1:200); Alexa Fluor 700–anti-human CD8 (SK1, 344724, 1:200); PerCP/Cyanine5.5–anti-human IFNγ (B27, 506528, 1:200); Brilliant Violet 711–anti-human CD366 (TIM-3) (F38-2E2, 345024, 1:400); Brilliant Violet 605–anti-human CD25 (BC96, 302632, 1:200); PE/Cyanine7–anti-human CD122 (IL-2Rβ) (TU27, 339014, 1:200); PE–anti-IFNγ (XMG1.2, 505808, 1:200). The following antibodies from BD Biosciences were used: PE–anti-STAT5 (pY694) (47, 612567, 1:20); PE–anti-NKG2A (16A11, 568952, 1:200); Brilliant Violet 605–anti-Ly108 (13G3, 745250, 1:400); Brilliant Violet 711–anti-CD94 (18d3, 740760, 1:400); Brilliant Violet 421–anti-active caspase-3 (C92-605.rMAb, 570863, 1:200); PerCP/Cyanine5.5–anti-human Ki-67 (B56, 561284, 1:200); Alexa Fluor 488–anti-human TNF (Infliximab297.rMAb, 570954, 1:100). Alexa Fluor 700–anti-TIM-3 (FAB1529RN, 1:400) was from R&D Systems, and APC–anti-human/mouse TOX (REA473, 130-118-335, 1:200) was from Miltenyi Biotec.
For p-STAT5 staining, splenocytes from LCMV Cl13-infected mice or TILs from B16-gp33 or B16-hCD19 melanoma were restimulated with 20 IU ml−1 rhIL-2 at 37 °C for 30 min in T cell medium containing antibodies for surface molecules, followed by fixation with 2% paraformaldehyde for 30 min at room temperature and permeabilization using 90% ice-cold methanol for 30 min on ice. Then, cells were stained for anti-STAT5 (pY694) (1:20) for 30 min at room temperature. Flow cytometry data were acquired using BD FACSDiva software (v8.0.1) on Fortessa or Symphony A3 cytometers (BD Biosciences) and were analysed using FlowJo software (v10.10.0; TreeStar). Representative gating strategies for all flow cytometry results are provided under Supplementary Fig. 1.
For in vivo labelling of circulatory or tissue-resident P14 cells in the spleen, PE–anti-CD8α (S18018E; 2 μg) prepared in PBS was injected intravascularly into LCMV Cl13-infected mice containing control and ZMYND8-deficient P14 cells at 21 dpi, and the recipient mice were euthanized 5 min after injection as previously described11. Splenocytes were prepared for flow cytometry analysis with surface staining using Alexa Fluor 700–anti-CD8α antibody (53-6.7, 1:400). The proportions of control and ZMYND8-deficient total P14 cells and their Tex subpopulations in the white pulp (PE–) and red pulp (PE+) were analysed by flow cytometry.
Naive CD8+ T cell RNP electroporation
For CRISPR–Cas9 editing of naive mouse CD8+ T cells, RNP complexes were prepared by mixing 2 µl of 100 µM sgRNA (Synthego) and 2 µl of 40 µM Cas9 (Alt-R S.p. Cas9 Nuclease), and incubated for 10 min at room temperature. Electroporation was performed on 1–3 × 10⁶ naive CD8+ T cells using the 4D-Nucleofector X Unit (with program DN100) and P3 primary cell 4D-Nucleofector X Kit (V4XP-3032, Lonza). Pre-warmed complete T cell medium (100 μl) was immediately added to cells, followed by incubation at 37 °C for 10 min to allow cells to recover. Cells were washed extensively before transfer into recipient mice.
In vitro acute and chronic stimulation of human CD8+ T cells
Peripheral blood mononuclear cells were isolated from consented healthy donors by density-gradient separation using Lymphoprep (GE Healthcare). Naive CD8+ T cells (CCR7+CD45RO–) were sorted and activated with ImmunoCult Human CD3/CD28 T Cell Activator (STEMCELL Technologies) at a density of 1 × 10⁶ cells ml–1 in X-VIVO 15 medium (Lonza) supplemented with 5% human serum (Sigma-Aldrich), 50 µM 2-mercaptoethanol and 1× penicillin–streptomycin–l-glutamine (Gibco). Two days after activation, RNP-Cas9 complexes were prepared as described above, and 1–2 × 10⁶ activated CD8+ T cells were electroporated using the 4D-Nucleofector X Unit (using program EH-115) and P3 primary cell 4D-Nucleofector X Kit (Lonza). Pre-warmed X-VIVO 15 medium (100 μl) was immediately added to the cells, followed by incubation at 37 °C for 15 min to allow cells to recover. Cells were then transferred to a 48-well plate (Corning) and cultured for 2 additional days in complete X-VIVO 15 medium supplemented with 50 IU ml−1 rhIL-2. Afterwards, for acute stimulation, edited human CD8+ T cells were maintained under the above culture conditions, with fresh medium and cytokines replaced every 2 days. For chronic stimulation, edited human CD8+ T cells were further activated with 2 μg ml–1 plate-bound anti-human CD3 antibody (OKT3, BioLegend), and cells were replated onto fresh anti-human CD3 antibody-coated plates and replaced with fresh X-VIVO 15 medium containing 50 IU ml–1 rhIL-2 every 2 days. Cells were collected and analysed by flow cytometry and immunoblot analyses as indicated in the figure legends. Intracellular staining for cytokines (for example, IFNγ) or GZMB in human CD8+ T cells cultured under both acute and chronic stimulation conditions was performed after stimulation with ionomycin and phorbol 12-myristate 13-acetate (PMA) in the presence of GolgiStop (monensin) for 4 h.
Fresh human blood leukopaks from healthy donors were obtained from the Blood Donor Center at St. Jude Children’s Research Hospital. Ethical oversight for studies involving human specimens was provided by the Institutional Review Board (IRB) of St. Jude Children’s Research Hospital. As all leukapheresis products were de-identified, the isolation of naive CD8+ T cells and related experiments did not constitute human-subjects research.
Ex vivo and in vivo killing assays
For ex vivo killing assay, splenocytes from naive CD45.2+ C57BL/6 mice were pulsed with 0.2 µM gp33–41 peptide (target) or the irrelevant OVA257–264 SIINFEKL peptide (non-target) at 37 °C for 1 h. Target and non-target cells were labelled with 0.5 μM Cell Trace Violet (CTV; Thermo Fisher Scientific) or 5 μM CTV, respectively, per the manufacturer’s instructions. Target (CTVlow) and non-target (CTVhi) cells were mixed at a 1:1 ratio and incubated with or without sgNTC and sgZmynd8-expressing Texprog (Ly108+CX3CR1–), effector-like (Ly108–CX3CR1+) and Texterm (Ly108–CX3CR1–) subpopulations (sorted from the spleen of the same host at 21 dpi (from the dual-colour transfer system)) at a 1:3 effector-to-target ratio for 16 h in T cell medium as described11. Percentage of specific lysis was calculated as follows: specific lysis (%) = 100 – (100 × percentage of gp33-pulsed targets remaining after co-culture with effectors)/(percentage of gp33-pulsed targets after culture without effectors).
In vivo killing assays were performed as previously described22. In brief, CD45.2+ splenocytes were pulsed with 0.2 µM gp33–41 peptide or PBS at 37 °C for 1 h. These antigen- or PBS-pulsed splenocytes were then labelled with 0.5 μM CTV (CTVlow) or 5 μM CTV (CTVhi), respectively, at 37 °C for 15 min. At 21 (for Fig. 2h), 36 (for Fig. 2j) or 28 (for Fig. 5p) dpi, the CTVlow and CTVhi splenocytes were mixed at a 1:1 ratio, and a total of 2 × 10⁷ cells were adoptively transferred to LCMV Cl13-infected mice that received sgNTC or sgZmynd8 (Ametrine+)-expressing cells (single-colour transfer system), followed by analysis of in vivo cytotoxicity against these splenocytes after 3 h.
Plasmid generation
To generate ZMYND8-V5 truncation constructs, the wild-type ZMYND8-V5 plasmid (Addgene #65401) was used as the template. All truncations were generated using the Q5 Site-Directed Mutagenesis Kit (E0554S, NEB) according to the manufacturer’s instructions. The primers used for each truncation were as follows: ΔPHD-F: ATTCCGTCCATCCTG, ΔPHD-R: ACAGTAGCAGAATGCATC; ΔBRD-F: TTTACTCTGGGTCTCG, ΔBRD-R: GAAGTATGTCCAGAATGTTATC; ΔPWWP-F: ATTGCTACAAGGCTCAC, ΔPWWP-R: ATTCCTTTTTCTGTGAAAAAG; ΔPHD–BRD–PWWP-F: ATTCCGTCCATCCTG, ΔPBP-R: ATTCCTTTTTCTGTGAAAAAG; ΔMYND-F: CCACTGCTTCTTCTTG, ΔMYND-R: ACCCAGTCAGCTACTG.
Immunoprecipitation and immunoblot analyses
For immunoprecipitation in Extended Data Fig. 9m, 2 × 10⁷ activated CD8+ T cells were lysed in ice-cold Pierce IP Lysis Buffer (87787, Thermo Fisher Scientific) supplemented with protease and phosphatase inhibitor cocktail (78442, Thermo Fisher Scientific). The cell lysates were then incubated with 2 µg of anti-ZMYND8 (11633-1-AP, Proteintech) or normal rabbit IgG (2729, Cell Signalling Technology) antibody, with rotation overnight at 4 °C, followed by incubation with Protein A/G magnetic beads (88802, Thermo Fisher Scientific) for 3 h. The beads were washed 3 times with ice-cold IP lysis buffer, resuspended with 1× Laemmli sample buffer (1610747, Bio-Rad), and then boiled at 95 °C for 10 min, followed by immunoblot analysis.
For immunoprecipitation in Extended Data Fig. 9p, HEK293T cells (4 × 10⁵) were seeded in each well of a 6-well plate, and plasmids were transfected when the cells reached approximately 80% confluency. In brief, wild-type or truncated ZMYND8-V5 constructs, together with 5 μg pcDNA3.1-p300-6×His, were mixed with TransIT-293 (MIR 2706, Mirus Bio) in 200 μl Opti-MEM medium (31985, Gibco) for each well. The total amount of each ZMYND8-V5 truncation construct was optimized to achieve comparable expression (0.5 μg for wild-type and ΔMYND, 0.6 μg for ΔPHD, ΔBRD and ΔPWWP, and 0.8 μg for ΔPHD–BRD–PWWP). At 36 h after transfection, HEK293T cells were lysed in ice-cold Pierce IP Lysis Buffer containing protease and phosphatase inhibitor cocktail with rotation at 4 °C for 30 min. The cell lysate was centrifuged at 13,000g for 10 min at 4 °C, and the supernatant was incubated with anti-V5 magnetic beads (SAE0203, Sigma-Aldrich) at 4 °C for 2 h. Beads were washed 3 times with ice-cold IP Lysis Buffer and resuspended with 1× complete Laemmli sample buffer. All the protein samples were boiled at 95 °C for 10 min, and then separated for immunoblot analysis.
For immunoblot analysis, cells were lysed in RIPA buffer (Thermo Fisher Scientific) supplemented with protease and phosphatase inhibitor cocktail. The protein concentrations of cell lysates were determined by BCA protein assay kit (Thermo Fisher Scientific). Equivalent amounts of total protein were denatured by adding Laemmli protein sample buffer (Bio-Rad) and boiling at 95 °C for 5 min, and then separated using 4–12% Criterion XT Bis-Tris protein gel (3450125, Bio-Rad) and transferred to polyvinylidene fluoride (PVDF) membranes (1620177, Bio-Rad). The membranes were blocked using 3% Bovine Serum Albumin (BSA) (A9418, Sigma-Aldrich) for 1 h at room temperature and then incubated overnight with primary antibodies at 4 °C. The membranes were washed three times with Tris-buffered saline containing 0.1% Tween-20 (TBST) and then incubated with secondary antibodies for 2 h at room temperature. After washing three times with TBST, HRP was activated with SuperSignal West Dura Extended Duration Substrate (34075, Thermo Fisher Scientific) and visualized with chemiluminscent detection system using Amersham Imager 600 (GE Healthcare Life Sciences). The blots were then processed and quantified using Image J software.
Primary antibodies and dilutions were as follows: anti-ZMYND8 (1:1,000, 11633-1-AP) and anti-V5 tag (1:3,000, 14440-1-AP) were from Proteintech; anti-6× His tag (1:1,000, ab18184) was from Abcam; anti-phospho-STAT5 (Y694) (1:1,000, 9351S), anti-STAT5 (1:1,000, 94205S), anti-STAT5B (1:1,000, 34662S), anti-IL-2Rα/CD25 (1:1,000, 36128S), anti-p300 (1:1,000, 57625S), anti-GAPDH (1:5,000, 2118S) and anti-β-Actin (called ACTB;1:5,000, 4970) were from Cell Signalling Technology. Secondary antibodies and dilutions were as follows: HRP-conjugated anti-rabbit IgG (H + L) (1:3,000, W4011) and HRP-conjugated anti-mouse IgG (H + L) (1:3,000; W4021) were from Promega, and HRP-conjugated anti-rabbit IgG, light chain specific (1:3,000; SA00001-7L) was from Proteintech. Densitometric quantification of phosphorylated protein levels was normalized relative to the corresponding total protein, and densitometric quantification of total protein expression was normalized relative to the loading control ACTB. All densitometric quantifications depict the fold changes compared with the relative control (set equal to 1.0) and are shown below the immunoblot image.
RNA isolation and gene expression profiling
Cells were lysed with Buffer RLT in the RNeasy Mini Kit (QIAGEN), and total RNA was extracted according to the manufacturer’s instructions. Then, 1 μg total RNA was reverse transcribed using the High-Capacity cDNA Reverse Transcription Kit (Applied Biosystems). The cDNA was then diluted and added to Power SYBR Green Master Mix (Applied Biosystems) containing gene-specific PCR primers. Gene amplification was assessed using QuantStudio7 Flex Real-Time PCR System (Applied Biosystems). Actb was used as the housekeeping control. A list of the primers is provided in Supplementary Table 12.
Luciferase assay
pGL4.23-IL2RA CaRE4 scramble (#91852), pGL4.23-IL2RA CaRE4 (#91850), GFP-ZMYND8 (#65401) and pcDNA3.1-p300 (#23252) were obtained from Addgene, and pTK-Green Renilla Luc Vector (16154) was from Thermo Fisher Scientific. Among them, pGL4.23-IL2RA CaRE4 scramble and pGL4.23-IL2RA CaRE4 plasmids contain a scrambled sequence and the IL2RA enhancer CaRE4 sequence, respectively, both upstream of a generic minimal promoter28. For the experiments shown in Fig. 4f and Extended Data Fig. 9o, each Firefly luciferase (Luc) IL2RA CaRE4 or scramble construct (500 ng) and Renilla Luc plasmid (70 ng) were electroporated with or without p300-expressing plasmid (500 ng) alone or together with wild-type or indicated mutant ZMYND8-expressing plasmid (500 ng) into 5 × 10⁵ Jurkat cells using the 4-D Nucleofector (with program CL-120) and 20 μl Nucleofection Buffer SE (V4XC-1032, Lonza). Jurkat cells were rested for 18 h and then split into either an untreated control plate or stimulation plate pre-coated with anti-human CD3 (clone OKT3, 10 μg ml−1, BioLegend) and anti-human CD28 (clone CD28.2, 10 μg ml−1, BioLegend) antibodies. Luciferase expression was assessed using the Dual-Glo Luciferase Assay (E2920, Promega) on a 96-well plate luminometer after 24 h of stimulation. Firefly Luc activity was normalized to Renilla Luc activity for each well and was reported as fold induction over pGL4.23-IL2RA scramble vector under unstimulated condition.
CUT&RUN assay
Sample preparation and sequencing
Total Cas9+ P14 cells transduced with sgNTC (Ametrine+) or sgZmynd8 (GFP+) were sorted from the spleen of LCMV Cl13-infected recipient mice at 7 dpi (due to abundant expression of IL-2R at this time point (Extended Data Fig. 1k,l)), or 3 Tex subpopulations (Ly108+CX3CR1−, Ly108−CX3CR1+ and Ly108−CX3CR1−) among control (sgNTC-expressing) P14 cells were sorted at 21 dpi. A total of 0.5–1 × 10⁵ cells were used for CUT&RUN using the CUTANA ChIC/CUT&RUN Kit (EpiCypher) according to the manufacturer’s instructions. The antibodies (0.5 μg per reaction) used for CUT&RUN were as follows: anti-ZMYND8 (11633-1-AP) was from Proteintech; Rabbit IgG negative control antibody (13-0042) and anti-H3K4me3 (13-0041) were from EpiCypher; anti-H3K4me1 (ab176877), anti-H3K36me2 (ab9049), anti-H3K14Ac (ab52946), anti-H3K27Ac (ab4729) and anti-H4K16Ac (ab109463) were from Abcam. anti-p300 (57625S) was from Cell Signalling Technology. Here is the detailed information about the biological replicates for CUT&RUN samples: for Fig. 4d and Extended Data Fig. 9a, IgG (n = 2), anti-ZMYND8 (n = 3) and anti-p300 (n = 2); for Fig. 4c and Extended Data Fig. 9d (n = 2 for all histone modification samples). Representative genome tracks from one biological replicate are shown; for Fig. 4e and Extended Data Fig. 9j, n = 2 for each antibody (anti-H3K27Ac, anti-ZMYND8 and anti-p300) in either sgNTC or sgZmynd8-expressing cells. Representative genome tracks from one biological replicate are shown; for Extended Data Fig. 9e, Texprog (n = 1), effector-like (n = 2) and Texterm (n = 2). CUT&RUN-enriched DNA from H3K27Ac, ZMYND8 or p300 CUT&RUN assays was quantified by qPCR in Extended Data Fig. 9k,l using specific primers, as previously described49 (Supplementary Table 12). The Actb gene sequence was used as control genomic locus. The CUT&RUN–qPCR data was normalized and analysed using the comparative CT method (also known as 2–ΔΔCT method), as previously described49. Primer sequences used in CUT&RUN–qPCR are provided in Supplementary Table 12. Alternatively, CUT&RUN libraries were prepared using CUTANA CUT&RUN Library Prep Kit (EpiCypher) according to the manufacturer’s protocol. Barcoded libraries were quantified on an Agilent TapeStation. The final libraries were sequenced on the Illumina NovaSeq platform using paired-end (2× 50 bp) with target reads of 20 million per sample. Representative in-house generated raw and processed CUT&RUN assay data shown in Fig. 4c–e and Extended Data Fig. 9a,d,e,j have been deposited into the GEO database with the Superseries identifier GSE342764.
Data analysis
CUT&RUN raw reads were processed using nf-core/cutandrun pipeline50. The peaks for the histone marks, ZMYND8 and p300 binding peaks were called by seacr51 (for histone marks) or MACS252 (for ZMYND8 and p300) algorithms. Genome annotation of binding sites was performed by plotAnnoBar function in ChIPseeker R package53 (v1.40.0). The numbers of intersected peak regions were calculated by enrichPeakOverlap function in ChIPseeker. ZMYND8 binding sites shown in Extended Data Fig. 9a were identified in at least two of three CUT&RUN samples using anti-ZMYND8 in P14 cells compared with isotype control. In addition, a two-tailed Fisher’s exact test was used to assess whether an MSigDB gene set was significantly enriched (P < 0.05) among genes nearest to ZMYND8 binding sites. Tracks were visualized using Integrative Genomics Viewer (IGV, v2.4.13). For Cistrome transcriptional regulator binding or histone mark analysis54, ZMYND8-bound regions were uploaded to http://dbtoolkit.cistrome.org/ to analyse transcriptional regulators (including transcription factors and chromatin regulators) or histone marks with significant binding overlaps using default parameters. For comparing H3K27Ac level in Texprog, effector-like and Texterm cells, consensus peak regions were generated by concatenating the H3K27Ac peak files from all samples, sorting the resulting genomic intervals, and merging overlapping or adjacent peaks using bedtools software (v2.25.0). Read counts over the consensus peak regions were then quantified using bedtools ‘multicov’ command, which calculated the number of sequencing reads overlapping each peak from the aligned BAM file of each sample. The resulting peak-by-sample count matrix was used for downstream quantitative and differential analysis using DESeq2 R package55 (v1.32.0). Normalized average H3K27Ac read counts at the ZMYND8-bound active enhancer region of the Il2ra locus were visualized by ComplexHeatmap R package (v2.20.0). The code for analysis of CUT&RUN data in the relevant figure panels has been deposited to Zenodo (https://doi.org/10.5281/zenodo.21924005 (ref. 56)).
scRNA-seq
Sample preparation
Cas9-expressing P14 cells transduced with either sgNTC (Ametrine+) or sgZmynd8 (GFP+) were mixed at a 1:1 ratio and then injected intravenously into the same Cas9+ recipient mice, followed by LCMV Cl13 infection (n = 2 per group). sgNTC and sgZmynd8-transduced Cas9+ P14 cells were sorted from the same host at 21 dpi. After cell counting and centrifugation at 2,000 rpm for 5 min, the supernatant was removed, and cells were resuspended and diluted in 1× PBS containing 0.04% BSA at concentration of 1 × 10⁶ cells per ml. Single-cell libraries were prepared using a Chromium Single Cell 3′ Library and Gel Bead kit (v3.1; 10X Genomics). In brief, the single-cell suspensions were loaded onto the Chromium Controller according to their respective cell counts to generate 9,000 single-cell gel beads in emulsion per sample. Each sample was loaded into a separate channel. The cDNA content of each sample after cDNA amplification of 12 cycles was quantified and quality checked using a High Sensitivity D5000 chip in a TapeStation (Agilent Technologies) to determine the number of PCR amplification cycles to produce a sufficient library for sequencing. After library quantification and quality checking using a D5000 chip (Agilent Technologies), samples were diluted to 3.5 nM for loading onto a HiSeq 4000 (Illumina) with a 2× 100-bp paired-end kit using the following cycles: 28 cycles read 1, 10 cycles i7 index, 10 cycles i5 index and 90 cycles read 2. An average of 300 million reads per sample was obtained (approximately 20,000 reads per cell). In-house generated raw and processed scRNA-seq data have been in the NCBI GEO database and are accessible through the GEO SuperSeries access number GSE342764.
Data analysis
FASTQ files were processed using Cell Ranger57 (v7.1.0) using the Cell Ranger count command with default settings. Gene expression reads were aligned to the mouse genome (mm10 from ENSEMBL GRCm38 loaded from 10X Genomics). Underlying cell variations derived in P14 cells in the single-cell gene expression data were visualized using a two-dimensional projection by UMAP with the Seurat R package58 (v5.1.0). sgNTC and sgZmynd8-transduced Cas9+ P14 cells were further clustered and annotated as four cellular states (Texprog, Texint, TexKLR and Texterm): Tcf7+Slamf6+ (Texprog), Cx3cr1+Mki67+Klrg1low (Texint), Cx3cr1+Klrg1hiKlre1hiKlrc1hiKlrd1hi (TexKLR) and Cx3cr1–Cd101+ (Texterm). Violin and dot plots that depict the expression levels of selective genes were generated using the VlnPlot and DotPlot function, respectively, in the Seurat R package. Activity scores of gene signatures curated from public gene sets or data generated in-house (see below for details) were calculated using the AddModuleScore function in Seurat. Ahmed CXCR5+ stem-like CD8+ T cell59 and Ahmed CXCR5– terminally differentiated CD8+ T cell59 signatures were curated by comparing CXCR5+CD8+ T cells with TIM-3+CD8+ T cells from LCMV Cl13-infected mice (GSE84105); the gene signatures were generated using the top 200 upregulated genes and top 200 downregulated genes (ranked by log2FCs), respectively. The Kaech effector and memory signatures60 were curated by comparing IL-7Rlow with IL-7Rhi effector CD8+ T cells from microarray analysis (GSE8678); the Kaech effector gene signature was generated using the top 200 upregulated genes (ranked by log2FCs) followed by removal of probes without gene names, while the Kaech memory gene signature was generated using the top 200 downregulated genes (ranked by log2FCs) followed by removal of probes without gene names. The Regev cell cycle signature was previously described61. The core tissue-resident memory T cell signature was previously described62. The STAT5CA upregulated (Up) and downregulated (Down) gene signatures were curated from a public scRNA-seq dataset of STAT5CA-expressing versus control CD8+ T cells (GSE214116)21 using genes with log2FC (STAT5CA versus control) >1 (Up) or <–1 (Down) and Bonferroni corrected P < 0.05. The in-house ZMYND8-activated signature was generated using downregulated genes (log2FC <–0.5; Bonferroni corrected P < 0.05) in sgZmynd8-expressing Havcr2 (encodes TIM-3)+ P14 cells versus sgNTC-expressing Havcr2+ P14 cells from scRNA-seq profiling at 21 dpi. The ZMYND8-suppressed signature was generated using upregulated genes (log2FC > 0.5; Bonferroni corrected P < 0.05) in sgZmynd8-expressing Havcr2+ P14 cells versus sgNTC-expressing Havcr2+ P14 cells from scRNA-seq profiling at 21 dpi. Epigenetic landscape in silico deletion analysis (LISA)63 (https://lisa.cistrome.org/) was performed using the top 250 upregulated genes (ranked by log2FC) in sgZmynd8-expressing compared with sgNTC-expressing total P14 cells to infer the transcription factors with upregulated activity upon ZMYND8 deficiency. Pseudotime trajectory analysis was performed to infer the differentiation trajectory of Tex cells in sgNTC and sgZmynd8-expressing P14 cells. The analysis was conducted (using the default parameters in the Monocle3 R package64 (v1.3.7)) on the four Tex states, with the Texprog state set as the starting point. Density plots were used to compare pseudotime distribution between genotypes or Tex differentiation states. In Extended Data Fig. 3f, the region between the dashed lines denotes the interval in which sgZmynd8-expressing P14 cells accumulated most prominently relative to sgNTC controls. Consistent with the inferred trajectory, sgZmynd8-expressing cells were enriched primarily in the TexKLR state, and to a lesser extent the Texint state. The code for analysis of scRNA-seq data in the relevant figure panels has been deposited to Zenodo (https://doi.org/10.5281/zenodo.21924005 (ref. 56)).
Pre-ranked GSEA
For scRNA-seq analysis, to compare gene expression between genotypes (sgZmynd8-expressing compared with sgNTC-expressing), a non-parametric two-tailed Wilcoxon rank-sum test was applied, and genes were ranked by log2FC values. GSEA (v4.2.3) analysis of the STAT5CA Up signature in sgZmynd8-expressing P14 compared with sgNTC cells was used to derive leading-edge genes65, and those showing significant upregulation (log2FC > 0.5, adjusted P < 0.05) in sgZmynd8-expressing cells are shown in the heatmap. For pathway enrichment analysis, pre-ranked GSEA (an analysis of GSEA against a user-supplied, ranked list of genes) was then performed using the MSigDB collection (v7.4) for each comparison65.
Public dataset analysis
Multiple public scRNA-seq datasets from the GEO databases were re-analysed to examine the correlation of Zmynd8 (mouse) or ZMYND8 (human) expression and ZMYND8-activated and ZMYND8-suppressed activity scores (described above) with CD8+ T cell exhaustion. Seurat R package (v5.1.0) was used for preprocessing and visualization, similar to that used for the in-house generated data. Zmynd8 expression in endogenous H2Db-gp33-specific CD8+ T cells from early and late stages of acute and chronic infection66 (Fig. 5a) and Tex states from chronic infection15 (GSE122712; Extended Data Fig. 11c) were visualized using the DotPlot function in Seurat. ZMYND8-activated and ZMYND8-suppressed activity scores in Tex states from chronic infection15 (GSE122712) were visualized using the VlnPlot function in Seurat. Zmynd8 expression in OT-I cells from B16-OVA melanoma31 (GSE216909) was visualized using the DotPlot function in Seurat. ZMYND8-activated and ZMYND8-suppressed activity scores in Tex states from B16-OVA melanoma31 (GSE216909) were visualized using the VlnPlot function in Seurat. For scRNA-seq datasets from a genetically engineered mouse model (GEMM) for lung cancer32 (GSE164177), ZMYND8-activated and ZMYND8-suppressed activity scores in CD8+ T cells were visualized using the VlnPlot function in Seurat. For the RNA-seq dataset from a GEMM for liver cancer33 (GSE89307), the relative expression of Tcf7, Pdcd1, Tox and the average expression of ZMYND8-activated or ZMYND8-suppressed genes of tumour-specific CD8+ T cells were visualized using the Heatmap function in the ComplexHeatmap R package (v2.20.0). For the dataset from human patients infected with HIV30 (GSE157829), ZMYND8 expression and ZMYND8-activated and ZMYND8-suppressed activity scores were examined in CD8+ T cells from the peripheral blood of healthy donor and HIV-infected individuals with low and high viral titre (as previously defined30). In the human melanoma dataset34 (GSE123139), the naive-like, transitional and dysfunctional CD8+ T cell annotations were based on the reported markers in each subpopulation31. ZMYND8 expression and the activity scores for ZMYND8-activated and ZMYND8-suppressed signatures were examined in these subpopulations.
To assess the correlation of the responsiveness to ICB with ZMYND8 activity in CD8+ T cells from human melanoma41 (GSE120575), the Kendall rank order correlation between ZMYND8 expression or the average expression of ZMYND8-activated genes and other reported markers that are positively associated (IL7R, SELL, TCF7) or negatively associated (HOPX, LGALS1, VCAM1, SNAP47, CCL3, FASLG, MT2A, EPSTI1, GBP1, PSMB2, NDUFB3, CD38, GBP4, WARS, PRDX3) with ICB response was performed in CD8+ T cells in patients with melanoma treated with ICB. For other skin cancers, such as advanced basal cell carcinoma (BCC)39 (GSE123813) and squamous cell carcinoma (SCC)39 (GSE123813), ZMYND8 expression and the activity scores of ZMYND8-activated and ZMYND8-suppressed signatures were compared using violin plots in the CD8+ T cell clusters (originally annotated in the literature39) after ICB treatment. For colorectal cancer (GSE205506)40, the ZMYND8-activated and ZMYND8-suppressed activity scores were compared in intratumoural CD8+ T cells from patients who achieved pathological complete response (pCR) or non-pCR after ICB treatment, as well as untreated patients.
To assess the correlation of the responsiveness to IL-2 therapy with ZMYND8 activity in CD8+ T cells during chronic infection, the activity scores of the ZMYND8-activated and ZMYND8-suppressed signatures were compared in P14 cells from LCMV Cl13-infected mice treated with or without IL-2 (GSE206732)24. For tumour models, the activity scores of ZMYND8-activated and ZMYND8-suppressed signatures were compared in CD8+ T cells from B16F10-B2m–/– melanoma treated with vehicle and mRNA-encoded IL-237 or from T3 sarcoma tumours at day 2 after treatment with vehicle or IL-2 (GSE252650)38.
Single-cell multiome profiling
For multiome analysis, sgNTC and sgZmynd8-expressing Cas9+ P14 cells were sort-purified from the spleens of recipient mice at day 21 post-LCMV Cl13 infection (n = 2 per group). All samples were centrifuged at 2,000 rpm for 5 min at 4 °C. The supernatant was removed, and the pellets were resuspended in 50 μl 1× PBS plus 0.04% BSA. Nuclei for Single Cell Multiome ATAC + Gene Expression Sequencing were isolated, washed, and counted per manufacturer’s instructions (10X Genomics). Single nuclei suspensions were loaded onto the Chromium Controller according to their respective cell counts to generate single nuclei GEMs per the manufacturer’s protocol. Each sample was loaded into a separate channel. Libraries were prepared using the Chromium Next GEM Single Cell Multiome ATAC + Gene Expression Reagent Bundle (10X Genomics). The cDNA content of each sample was amplified (7 cycles for ATAC library, 12 cycles for Gene Expression library), and then quantified and quality checked using a High Sensitivity DNA chip with a TapeStation 4200 analyser (Agilent Technologies). Samples for ATAC library sequencing were diluted to 150 pM for loading onto the NovaSeq (Illumina) with a 2× 100 paired-end kit using the following read cycles: 50 cycles Read 1 N, 8 cycles i7 Index, 24 cycles i5 Index, and 49 cycles Read 2 N. An average of 343,111,424 reads per sample was obtained (~45,285 read pairs per nucleus). Samples for Gene Expression library sequencing were diluted to 150 pM for loading onto the NovaSeq (Illumina) with a 2× 100 paired-end kit using the following read cycles: 28 cycles Read 1, 10 cycles i7 Index, 10 cycles i5 Index, and 90 cycles Read 2 N. An average of 439,208,964 reads per sample was obtained (~57,979 read pairs per nucleus).
For single-nuclear RNA-seq (snRNA-seq) analysis from multiome profiling, the Cell Ranger ARC v2.0.2 Single-Cell Software Suite (10X Genomics) was implemented to process the raw sequencing data from the Illumina HiSeq run. This pipeline performed de-multiplexing, alignment (mm10), and barcode processing to generate gene-cell and peak-cell matrices used for downstream gene expression and ATAC analysis, respectively. Cells with low or high unique molecular identifier (UMI) counts were filtered. A total of 24,160 cells (sgNTC replicate 1: 4,764; sgNTC replicate 2: 7,142; sgZmynd8 replicate 1: 5,241; and sgZmynd8 replicate 2: 7,013) were captured with an average of 363 mRNA molecules (UMIs, median: 327, range: 196–1,770). The expression level of each gene was normalized using the NormalizeData function with a scale factor of 106. In-house generated processed multiomics data have been deposited in the NCBI GEO database and are accessible through the GEO SuperSeries access number GSE342764.
Sample merging and processing in scATAC–seq
ATAC peaks from each sample were merged to create a common peak set and quantified by Signac R package (v1.14.0). Specifically, peak coordinates for each sample were loaded and converted to genomic ranges. The ‘reduce’ function in GenomicRanges R package (v1.55.4) was used to first create a common set of peaks. Fragment objects were created using the CreateFragmentObject function for each sample to quantify peaks using the FeatureMatrix function. Quantified matrices were used to create a Seurat object for each sample, and the standard merge function was then used to merge the objects. Normalization and linear dimensional reduction were performed on the merged single-cell ATAC–seq (scATAC–seq) dataset through latent semantic indexing using RUNTFIDF, FindTopFeatures, and RunSVD functions with default parameters. The scATAC–seq dataset was then integrated with snRNA-seq data through the corresponding cell barcode for each cell. Using the weighted nearest-neighbour methods in the Seurat R package, a joint neighbour graph that represents both the gene expression and DNA accessibility measurements was computed by FindMultiModalNeighbors function. CD8+ T cell states were annotated by their markers similar as the scRNA-seq analysis.
Differential accessibility, motif enrichment analysis
Differentially accessible peaks between cell types or genotypes were calculated by the FindMarkers function with min.pct = 0.1. Transcription factor motifs were identified using the FindMotifs function based on the differentially upregulated and downregulated peaks. Additionally, we also computed a per-cell motif activity score by running ChromVAR (runChromVAR function) in the Signac R package (v1.14.0) and directly tested for differential activity scores between genotypes in P14 cells or the indicated Tex cell states using the FindMarkers function. The code for analysis of multiomics data in the relevant figure panels has been deposited to Zenodo (https://doi.org/10.5281/zenodo.21924005 (ref. 56)).
ATAC–seq
Sample preparation
Cas9-expressing P14 cells transduced with either sgNTC (Ametrine+) or sgZmynd8 (GFP+) were mixed at a 1:1 ratio and then injected intravenously into the same Cas9+ recipient mice, followed by LCMV Cl13 infection. At 14 dpi, Texprog (Ly108+TIM-3–) and effector-like (Ly108–TIM-3+) cells were sorted from the same host for ATAC–seq analysis (n = 4 biological replicates per group). Sorted cells were incubated in 50 µl ATAC–seq lysis buffer (10 mM Tris-HCl, pH 7.4, 10 mM NaCl, 3 mM MgCl2, 0.1% IGEPAL CA-630) on ice for 10 min. The resulting nuclei were pelleted at 500g for 10 min at 4 °C. The supernatant was carefully removed with a pipette and discarded. The pellet was resuspended in 50 µl transposase reaction mix (25 µl 2× TD buffer, 22.5 µl nuclease-free water and 2.5 µl transposase) and incubated for 30 min at 37 °C. After the reaction, the DNA was cleaned up using the QIAGEN MinElute kit. The barcoding reaction was run using the NEBNext HiFi kit based on manufacturer’s instructions and amplified for five cycles as described19,22 using the same primers. The optimal cycle numbers were assessed from 5 µl (of 50 µl) from the previous reaction mix using KAPA SYBRFast (Kapa Biosystems) and a 20-cycle amplification on an Applied Biosystems 7900HT. Optimal cycles were determined from the linear part of the amplification curve, and the remaining 45 µl of PCR reaction was amplified in the same reaction mix using the optimal cycle number.
Data analysis
ATAC–seq analysis was performed as previously described19,22. In brief, 2× 50 bp paired-end reads from NovaSeq were trimmed for Nextera adapters using Trimmomatic (v0.36; paired-end mode, parameters: LEADING:10 TRAILING:10 SLIDINGWINDOW:4:18 MINLEN:25) and aligned to the mouse genome mm10 with BWA (v0.7.16, default parameters). Duplicates were marked using Picard (v2.9.4), and only non-duplicated, properly paired reads were retained with SAMtools (-q 1 -F 1804, v1.9). To account for Tn5 transposase shift, reads were offset by +4 bp (sense strand) and –5 bp (antisense strand), then separated into nucleosome-free, mono-, di-, and tri-nucleosome fractions by fragment size as described67. BigWig files were generated using the central 80 bp of fragments, scaled to 3 × 10⁷ nucleosome-free reads. Clear nucleosome-free peaks and mono-, di-, and tri-nucleosome patterns were observed in IGV (v2.4.13). All samples yielded ~2 × 10⁸ nucleosome-free reads, indicating high data quality. Next, peaks were called on nucleosome-free reads using MACS2 (v2.1.1.20160309, parameters: –extsize 200 –nomodel). To ensure reproducibility, peaks were retained only if called with a stricter cutoff (MACS2 -q 0.05). Consensus peaks were defined as those present in ≥50% of replicates, with non-reproducible peaks discarded. Between sgNTC and sgZmynd8-transduced Texprog and effector-like cells, reproducible peaks overlapping by ≥100 bp were merged. Read counts for each region were obtained with bedtools (v2.25.0).
For differential accessibility analysis, nucleosome-free reads were normalized to counts per million, and differences were assessed using a negative binomial model implemented in DESeq2 R package (v1.32.0)55. Differentially accessible open chromatin regions (OCRs) were defined as those with P < 0.05 and |log2FC|> 0.5. PCA was performed with the prcomp function in R. Differential accessibility regions were assigned to the nearest genes using HOMER (v4.9.1) software68, and functional enrichment was assessed with MSigDB signatures69 by a two-tailed Fisher’s exact test. For motif analysis, 1,000 unchanged regions (P > 0.5) were used as background. Motifs were scanned using FIMO from the MEME suite70 (v4.11.3; parameters: –thresh 1e-4 –motif-pseudo 0.0001) against the TRANSFAC 2019 Vertebrata database. Enrichment in differential accessible OCRs versus background was evaluated with two-tailed Fisher’s exact tests. For transcription factor footprinting, binding activity was inferred and visualized using RGT-HINT71 (v0.13.2). For Cistrome transcriptional regulator binding analysis, OCRs with increased accessibility (P < 0.05 and log2FC > 0.5) in sgZmynd8-expressing Texprog and effector-like cells compared to sgNTC counterparts were uploaded to http://dbtoolkit.cistrome.org/ to analyse transcriptional regulators (including transcription factors and chromatin regulators) with significant binding overlaps using default parameters. Genome tracks of average ATAC–seq signals (for each genotype) in indicated gene loci were presented using Integrative Genomics Viewer (IGV, v2.4.13). In-house generated raw and processed ATAC–seq data have been deposited in the NCBI GEO database and are accessible through the GEO SuperSeries access number GSE342764. The code for analysis of ATAC–seq data in the relevant figure panels has been deposited to Zenodo (https://doi.org/10.5281/zenodo.21924005 (ref. 56)).
In vivo single-cell and bulk CRISPR screening
Selection of epigenetic factors for library design
To select the epigenetic factors that were potentially involved in CD8+ T cell exhaustion in the chronic infection, we performed differential gene expression analyses from public scRNA-seq11,15 (GSE149876 and GSE122712) and RNA-seq15 (GSE123235) datasets and differential accessibility analysis of OCRs in a scATAC–seq dataset16 (GSE230363), to nominate genes with differential expression/accessibility (threshold: log2FC > 0.3, P < 0.05 for Up; log2FC < –0.3, P < 0.05 for Down) between different Tex states (Texterm versus Texprog, Texterm versus effector-like or Texprog versus effector-like). Those genes with differential expression or accessibility were overlapped with two published gene lists16,72 of epigenetic factors to select a total of 91 epigenetic factors. Nine transcription factors (Bach273, Batf17,18,19, Myb74, Prdm175, Tbx2176, Tcf777,78, Tox4,5,6,7,8, Tox28 and Zeb279,80) known to regulate Tex cell differentiation were also included in the custom library for a total of 100 genes targeted (Supplementary Table 1).
Sample preparation
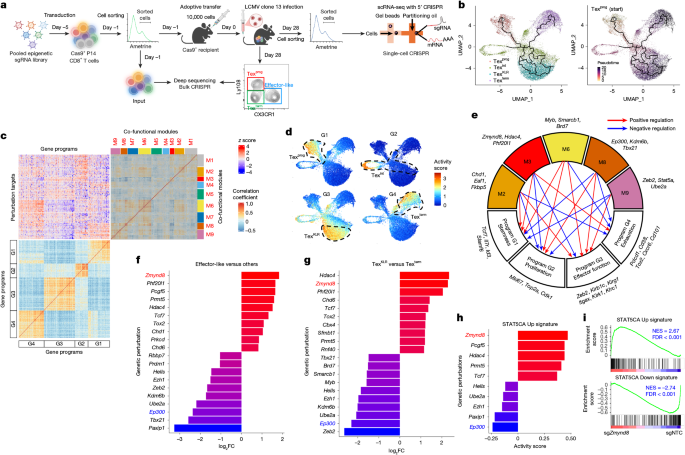
The in vivo screening approach was modified based on previous studies19,31. In brief, retrovirus was produced by co-transfecting the retroviral library with pCL-Eco (Addgene, #12371) in Plat-E cells. 48 h after transfection, the supernatant containing viral particles was collected and frozen at −80 °C. Cas9-expressing P14 cells were transduced to achieve 20–30 % transduction efficiency. Transduced cells were sorted based on the expression of Ametrine, and an aliquot of 1 × 10⁶ transduced Cas9+ P14 cells was saved as ‘input’. Transduced Cas9+ P14 cells (1 × 10⁴) were then transferred intravenously to Cas9+ mice followed by LCMV Cl13 infection (2 × 10⁶ PFU) one day later. A total of 60 recipient mice were used in 2 screens combined (in Fig. 1a). For scCRISPR screening, donor-derived total P14 cells from a total of 15 Cas9+ mice were sorted and pooled for scCRISPR analysis at 28 dpi. In total, five 10X reactions (Chromium Next GEM Single Cell 5’ Kit v2, PN-1000263 and 5’ CRISPR Kit, PN-1000451) were used. In-house generated raw and processed scCRISPR screening data have been deposited in the NCBI GEO database and are accessible through the GEO SuperSeries access number GSE342764. For bulk CRISPR screening, donor-derived Texprog (Ly108+CX3CR1–), effector-like (Ly108–CX3CR1+) and Texterm (Ly108–CX3CR1–) P14 subpopulations were sorted at 28 dpi and frozen at −80 °C prior to genomic DNA extraction. At least 5 × 10⁴ sorted Tex subpopulations (> 150× cell coverage per sgRNA) were used for deep sequencing analysis. For scCRISPR screening of IL-2 signalling regulators (Extended Data Fig. 1m), an in vivo scCRISPR screen targeting known positive regulators (Jak3, Stat5a and Stat5b) and negative regulators (Socs1 and Socs3) of IL-2 signalling (along with sgNTCs and additional validation controls for the screening phenotypes) was performed, using a similar strategy as described in Fig. 1a. The sgRNA library contained 3 sgRNAs targeting each of the IL-2 signalling genes. In-house generated processed scCRISPR screening data in Extended Data Fig. 1m have been deposited into Zenodo (https://doi.org/10.5281/zenodo.21909366 (ref. 81)).
Library preparation for scCRISPR screening
Sorted P14 cells were resuspended and diluted in 1× PBS (Thermo Fisher Scientific) containing 0.04% BSA (Amresco) at concentration of 1 × 10⁶ cells ml–1. Both the gene expression library and the CRISPR screening library were prepared using the Chromium Next GEM Single Cell 5’ v2 kit and 5’ CRISPR Kit for CRISPR Screening (10X Genomics). In brief, the single-cell suspensions were loaded onto the Chromium Controller according to their respective cell counts to generate 10,000 single-cell gel beads in emulsion (GEMs) per sample. Each sample was loaded into four separate channels. The resulting libraries were quantified, and quality checked by TapeStation (Agilent). Samples were diluted and loaded onto the NovaSeq (Illumina) to a sequencing depth of 300 million reads per channel for gene expression libraries and 200 million reads per channel for CRISPR screening libraries.
Data preprocessing
Alignments and count aggregation of gene expression and sgRNA reads were completed using Cell Ranger57 (v7.1.0). Gene expression and sgRNA reads were aligned using the cellranger count command with default settings. Gene expression reads were aligned to the mouse genome (mm10 from ENSEMBL GRCm38 loaded from 10X Genomics). sgRNA reads were aligned to sgRNA library using the pattern TATTTCTAGCTCTAAAAC(BC) to capture sgRNA sequences. Only droplets with ≥2 sgRNA UMIs were used in further analyses. The filtered feature matrices were imported to create assays for a Seurat object containing both gene expression and CRISPR guide capture matrices. A third assay summarizing the total gene-level counts of all four sgRNAs for each target gene was also created, followed by pooling of 5 samples using the ‘merge’ function. Cells were initially quality filtered based on the percentage of mitochondrial reads <10% (to remove dead cells) and the number of detected RNA features <7,500 and UMI feature <50,000 (to remove doublets for downstream gene expression analysis). Cells detected with sgRNAs targeting two or more genes were then removed to avoid interference from multi-sgRNA-transduced cells. A total of 19,032 P14 cells passed quality filtering and were used for downstream analysis. For the scCRISPR screening of IL-2 signalling regulators along with additional perturbations (Extended Data Fig. 1m), similar preprocessing was conducted as above. In brief, cells were first filtered based on the percentage of mitochondrial reads <10% (to remove dead cells) and the number of detected RNA features <6,000 and UMI feature <40,000 (to remove doublets for downstream gene expression analysis). Cells detected with sgRNAs targeting two or more genes were then removed to avoid interference from multi-sgRNA-transduced cells. A total of 2,825 P14 cells containing sgRNAs targeting IL-2 signalling genes (Jak3, Stat5a, Stat5b, Socs1 and Socs3) and sgNTC passed quality filtering and were used for downstream analysis. To evaluate the enrichment or depletion of each perturbation relative to sgNTC (Extended Data Fig. 1c), cells expressing sgRNAs targeting the same gene (3 sgRNAs per gene) were pooled. We calculated the log2FC in cell number by comparing the number of cells expressing each perturbation with the number of sgNTC-expressing cells, followed by normalization using the ratio of the number of sgRNAs targeting each perturbation to the number of sgNTC sgRNAs in the sgRNA library. To calculate replicate-level statistics for the relative enrichment and depletion of total P14 cells in Supplementary Table 7 (specifically, five 10X Genomics reactions (technical replicates) for the scCRISPR screen in Fig. 1a and eight technical replicates for the scCRISPR screen in Extended Data Fig. 1m), the average gene-level log2FC was calculated as the mean of gene-level log2FCs across all technical replicates. To assess the reproducibility of gene-level effects across technical replicates, two-sided, one-sample t-tests were performed on the replicate-specific, gene-level log2FC values against a null hypothesis of zero mean effect. Resulting P values were adjusted for multiple hypothesis testing using the Benjamini–Hochberg procedure to control the false discovery rate (FDR).
For cell clustering, the FindClusters function of the Seurat R package (v5.1.0) was used to identify the clusters in P14 cells in an unbiased manner. To determine the molecular determinants for P14 cell developmental trajectory, clusters were annotated as four cellular states (Texprog, Texint, TexKLR and Texterm) based on expression of indicated markers: Tcf7+Slamf6+ (Texprog), Cx3cr1+Mki67+Klrg1low (Texint), Cx3cr1+Klrg1hiKlre1hiKlrc1hiKlrd1hi (TexKLR) and Cx3cr1–Cd101+ (Texterm). Dot plots showing the relative average expression (after scaled normalization) of marker genes or effector molecules and cytokines in different clusters were visualized using the DotPlot function in the Seurat R package. Pseudotime trajectory analysis was performed (using default parameters in the Monocle3 R package64 (v1.3.7)) on the four Tex states with the Texprog state set as the starting point. Activity scores of gene signatures (such as the Texprog, Texint, TexKLR and Texterm signatures in Extended Data Fig. 1d curated from literature13) were calculated using AddModuleScore function of the Seurat package for the four cellular states and visualized by violin plots. To visualize the distribution of cells with a specific perturbation (at the gene level) on the UMAP, contour density plots were generated using the ggplot2 (v3.5.1) R package.
Network analysis
For network analysis, to mitigate the potential for observed phenotypes being driven by an outlier single sgRNA (which can be contributed by low cell recovery and/or sparse nature of scRNA-seq datasets), sgRNAs recovered in fewer than ten cells were excluded, similar as described31,82. Perturbations for which two sgRNAs failed to meet this minimum recovery threshold were excluded from downstream gene program analyses, resulting in the exclusion of a total of six genes (Batf, Ezh2, Nat10, Prmt1, Ssrp1 and Trim28). Along with 1,092 cells expressing sgNTC controls (representing 30 individual sgRNAs), we recovered an average of 189 cells per gene and 65 cells per sgRNA for gene-specific perturbations (Supplementary Table 6). log2FC (perturbation versus sgNTC) values were used to quantify the regulatory effect of each perturbation on target genes. The following bioinformatic analytical steps were applied to define regulomes associated with P14 cell differentiation. Step 1, similar to our previous publication31, our initial computational analysis calculated the individual gene regulatory effect of a specific genetic perturbation on target genes. Specifically, differential gene expression analysis was performed using the FindMarkers function in Seurat R package58, by comparing each perturbation to the sgNTC control. log2FC (perturbation versus sgNTC) values were used to quantify the regulatory effects of each perturbation on target genes. Step 2, to define co-regulated gene programs associated with Tex cell differentiation, differential expression analysis was performed by comparing each of the four Tex states with all other states combined. Differentially expressed genes (|log2FC (each state versus the other 3 states)| > 0.5) were combined, and redundant genes across states were removed. A gene × perturbation matrix (279 × 94, with log2FC of perturbation versus sgNTC values) was then constructed to generate a perturbation map (Fig. 1c, top left). Step 3, co-regulated gene programs (of the aforementioned 279 genes) were identified by Spearman correlation hierarchical clustering, with four major programs annotated, namely stemness (G1), proliferation (G2), effector function (G3) and exhaustion (G4) (Fig. 1c, bottom left), based on enrichment of pathways (Extended Data Fig. 1h). Meanwhile, co-functional modules were defined by Spearman correlation hierarchical clustering, resulting in nine modules labelled as M1–M9 (Fig. 1c, top right).
Step 4, following these initial steps to define gene regulatory effects, co-regulated gene programs, and co-functional modules, we then computed the average gene regulatory effect of a specific perturbation on a given gene program, defined as the average log2FC across all genes within that co-regulated gene program. As a final step, the average gene regulatory effect of a co-functional module on a given gene program was calculated as the mean of the gene regulatory effects across all genetic perturbations within the co-functional module (Fig. 1e and Extended Data Fig. 1i). The strength of regulation between perturbation modules and gene programs was visualized using the ggalluvial R package (v0.12.5), where the line width represents regulatory strength, colour (red versus blue) indicates positive or negative effects, and module height reflects the overall magnitude of regulation. The regulatory effect of perturbations on Tox expression was visualized by Cytoscape software (v3.10.3).
Gene-level perturbation ranking analysis
For gene-level perturbation ranking between Tex states (for example, Fig. 1f,g), cells expressing sgRNAs targeting the same gene (3 sgRNAs per gene) were pooled. For each gene perturbation, an enrichment score was calculated as the ratio of cells in a given Tex state relative to all other Tex states. To account for differences in the baseline abundance of individual Tex states, the enrichment score was normalized by the corresponding global cell ratio of that Tex state relative to all other Tex states across the entire dataset, and is reported as a normalized log2FC. To calculate replicate-level statistics for enrichment or depletion of Tex states (Supplementary Table 7), the average gene-level log2FC was calculated as the mean of gene-level log2FCs across all technical replicates. To assess the reproducibility of gene-level effects across technical replicates, the P values and FDR were subsequently calculated across the technical replicates as described above. GSEA was performed on the scCRISPR dataset by comparing sgZmynd8-expressing P14 cells with sgNTC-expressing P14 cells, using STAT5CA Up and Down gene signatures. The code for analysis of scCRISPR data in the relevant figure panels has been deposited to Zenodo (https://doi.org/10.5281/zenodo.21924005 (ref. 56)).
Library preparation for bulk CRISPR screening
Genomic DNA was extracted by using the DNeasy Blood & Tissue Kits (69506, QIAGEN). Primary PCR was performed by using the KOD Hot Start DNA Polymerase (71086, Millipore) and the following pair of Nextera next-generation sequencing (NGS) primers: (Nextera NGS forward (-F): TCGTCGGCAGCGTCAGATGTGTATAAGAGACAGttgtggaaaggacgaaacaccg; Nextera NGS reverse (-R): GTCTCGTGGGCTCGGAGATGTGTATAAGAGACAGccactttttcaagttgataacgg). Primary PCR products were purified using the AMPure XP beads (A63881, Beckman). A second PCR reaction was performed to attach Illumina adapters and indexes to barcode each sample. Hi-Seq 50-bp single-end sequencing (Illumina) was performed for library sequencing.
Data analysis for bulk CRISPR screening
FASTQ read files obtained after sequencing were demultiplexed using Hi-Seq analysis software (Illumina) and processed using mageck (v0.5.9.4) software83. Raw count tables were generated using the mageck count command by matching the sgRNA sequence of the aforementioned. Read counts for sgRNAs were normalized against median read counts across all samples for each screening. For each gene or sgRNA in the sgRNA library, the log2FC for enrichment or depletion was calculated using the mageck test command, with the gene-lfc-method parameter as the mean and control-sgrna parameter using the list of sgNTCs. The sgRNA count table and analysis of bulk CRISPR screening data have been deposited to Zenodo (https://doi.org/10.5281/zenodo.21909366 (ref. 81)). The code for analysis of bulk CRISPR data in the relevant figure panels has been deposited to Zenodo (https://doi.org/10.5281/zenodo.21924005 (ref. 56)).
Statistical analysis for biological experiments
For biological experiment (non-omics) analyses, data were analysed by Prism software (v11 for tumour growth curve experiments and v9 for other experiments; GraphPad) using two-tailed unpaired Student’s t-tests, one-way analysis of variance (ANOVA) or two-way ANOVA, as indicated in the figure legends. A two-tailed Student’s t-test was used to compare the two groups. For multiple comparisons, a one-way or two-way ANOVA with Tukey’s or Sidak’s multiple-comparisons test was applied. For comparing mouse tumour growth curves, two-way ANOVA with Geisser–Greenhouse correction was applied. The log-rank (Mantel–Cox) test was performed to compare mouse survival curves. Two-tailed Wilcoxon rank-sum tests were applied for activity score (without Bonferroni correction adjustment) or expression (with Bonferroni correction adjustment) analysis of scRNA-seq data. P < 0.05 was considered statistically significant with P value annotations shown as *P < 0.05, **P < 0.01, ***P < 0.001 and ****P < 0.0001. In all bar plots, data are presented as the mean ± s.e.m. The exact P values are shown in the source data files that accompany this manuscript.
Reporting summary
Further information on research design is available in the Nature Portfolio Reporting Summary linked to this article.