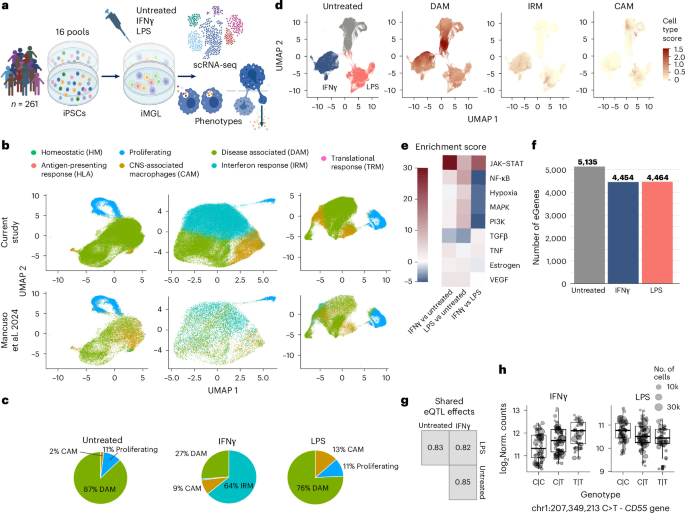
Full methods, including software versions, are available in the Supplementary Note. Data and code are publicly available as described in the data and code availability statements.
Human iPSC maintenance
Our research complies with all appropriate ethical regulations. Human iPSCs were derived as part of previous projects with informed consent from all participants, donors and/or their legal guardian(s). A total of 261 human iPSC lines from 254 European donors were obtained from the Sanger HipSci project (http://www.hipsci.org; Cambridgeshire 1 NRES REC Reference 09/H0304/77, HMDMC 14/013), the Cardiff IPMAR project (Wales REC 3 Reference 12/WA/0052)19 or commercially from Bioneer (TREM2 KO (BIONi010-C-17) and isogenic control (BIONi010-C)). All lines tested negative for mycoplasma and were characterized for pluripotency through stem cell marker expression, RNA-seq and/or germ layer differentiation. Genomes were analyzed by single nucleotide polymorphism (SNP) arrays, exome and/or WGS for chromosomal abnormalities and copy number variation and to validate identity. For a list of lines used and location of available datasets and certificates of analysis, see Supplementary Table 1.
Cells were vitronectin-maintained in E8/10% CloneR at 60–85% confluence. Before final pooling, 6–12 lines were seeded into mini-pools at 40,000 cells per cm2, passaged once and frozen after 3 days.
iPSC pooling and microglial differentiation
Microglia were differentiated through embryoid bodies20. Each pool contained between 16 and 72 donors. On day 9, 42 embryoid bodies were transferred to one T75 flask and differentiated into precursors. On days 28–109, the precursors were collected for a 14-day microglial differentiation. Cell suspensions were seeded in ITMG medium at 500,000 cells per 6-well plate (Greiner Bio-One, 657160) for scRNA-seq, 3,906,250 cells per T75 flask (Greiner Bio-One, 658170) for migration or 1,126,400 cells per 6-well plate for phagocytosis assays. Media was topped up to double the volume on day 3 or 4 post-plating, and subsequent half-media changes were performed on day 7 and day 10 or 11.
On day 11 of the microglial differentiation, cells were treated for 72 h with 20 ng ml−1 IFNγ or 100 ng ml−1 LPS.
iMac differentiation
The floating precursors were collected for a 7-day iMac differentiation72 in iMac media.
Sample preparation for scRNA-seq
Day-14 iMGLs were dissociated at 37 °C for ≤30 min with 5 mM EDTA and 4 mg ml−1 lidocaine, quenched in 0.04% BSA/DPBS, strained and counted. Chromium Next GEM 5′ v2 and 5′ HT v2 lanes received 17,400 and 115,405 viable cells, respectively, and followed manufacturer processing. Quality-controlled libraries were HiSeq/NovaSeq-sequenced at ≥20,000 reads per cell.
Migration assay
Each 6-well transwell insert received 825,000 day-14 iMGLs in 2.7 ml ITMG. After 15 min, 3.168 ml ITMG with or without 3 nM C5a was added to the lower chamber of the insert. After 6 h, sister wells were fixed in 4% paraformaldehyde, and DNA from each membrane surface plus wash pellet was Puregene-extracted.
NucBlue-stained inserts were imaged before and after removing upper-surface cells. Cellpose v.2.0.5 (–diameter 5 –flow_threshold 0 –cellprob_threshold -8) was used to count all nuclei, and CellProfiler v.4.2.1 was used to count migrated nuclei (threshold 0.015–1.0). Migration was calculated as the ratio of migrated nuclei to all nuclei, and chemotaxis was defined as the C5a+ minus C5a− ratio.
Dual color phagocytosis assay
The SH-SY5Y mCherry-eGFP pmChGIP F4 clone was generated and cultured as previously described20. Precursors (1,126,400 per 6-well plate) were differentiated for 14 days and incubated with fixed SH-SY5Y cargo at a 2:1 cargo:iMGL ratio for 2 h. Washed cells were detached, fixed in 4% paraformaldehyde and flow-sorted on a Mo-Flo XDP.
Genomic DNA library prep for phenotypic assays
DNA from migration and phagocytosis assays was quantified using a Qubit fluorometer. NEBNext Ultra II FS libraries with Dual Index Primer Set 1 were quality-controlled by Qubit, BioAnalyser or TapeStation and/or KAPA qPCR, multiplexed and sequenced on an Illumina NovaSeq 6000.
Cloning of Cas9-guide all-in-one vector
Three guide pairs per target and intergenic controls were array-cloned into an all-in-one vector. Sequences are listed in Supplementary Table 16, and the library can be made available upon request.
Primers containing the 5′ or 3′ guide were used to amplify the sgRNA backbone-tRNA region by PCR with Q5 High-Fidelity 2X Master Mix in an arrayed format to generate the dgRNA cassette62. Purified PCR products were cloned by Gibson assembly into BsmBI-v2-digested pLentiCRISPR v3.0 and transformed into DH5-α cells. Colonies were picked and verified by Sanger sequencing. Arrayed clones were pooled and expanded in electrocompetent cells. MiSeq verification of guide distribution was performed after nested PCR with KAPA HiFi HotStart ReadyMix with 12 cycles of 98 °C for 20 s, 60 °C for 15 s and 72 °C for 15 s. PCR1 was column-purified and 1/100 of the purified product was used as template for PCR2, with 14 cycles of 98 °C for 20 s, 70 °C for 15 s and 72 °C for 15 s.
Production of lentiviral particles
Lenti-X HEK293T cells (14 × 106 cells) at ~70% confluence were transfected with 7.5 μg pSIV3+ or library, 18.5 μg psPAX2 and 4 μg pMD2.G using Lipofectamine LTX. Virus collected at 48 h and 72 h was centrifuged, filtered (0.45 μm), concentrated at 20,000g for 3 h at 4 °C, resuspended in 1.5% BSA/DPBS and frozen at −80 °C following previously published methods73.
Total protein extraction and western blotting
Day-14 cells were lysed in RIPA buffer. BCA-quantified protein (10–40 μg) was reduced, boiled and run on 4–15% Mini-PROTEAN TGX gels at 100 V for 75 min, then transferred to PVDF under the same settings. Blocked membranes received primary antibodies overnight at 4 °C, followed by HRP-conjugated secondary antibodies for 1 h before chemiluminescent imaging. Densitometry values were normalized to housekeeping and untreated controls to determine ‘relative protein expression (to control)’.
CRISPR KO screening for phagocytosis
KOLF2.1S human iPSCs were differentiated to iMGLs as described above. The library contained 783 dual-guide all-in-one CRISPR vectors targeting 250 prioritized AD GWAS genes and 30 intergenic controls (‘NeuroKO’)7,14,52. The gRNA pairs were designed using anchor guides chosen from MinLib74 and paired with guides targeting the same exon using a tRNA-based dual-guide system62. Precursors were transduced at a multiplicity of infection between 1.2 and 1.5 along with a viral accessory protein (VPX) to improve transduction efficiency in this model75. We performed three biological replicates of the screen.
After terminal differentiation to iMGL for 14 days, iMGLs were incubated with pmChGIP SH-SY5Y for 6 h. Non-phagocytosed cargo was washed, iMGLs lifted and fixed with 2% paraformaldehyde before sorting on the mCherry signal into four bins: the top 20%, 55–75% (upper middle), 25–45% (lower middle) and bottom 20%. dgRNA sequences were amplified and indexed by PCR and sequenced by Illumina NovaSeq. Following deconvolution, dgRNA sequences were quantified by MAGeCK76. Mapping efficiency and guide representation, assessed using the Gini index, were examined with MAGeCKFlute77 to confirm data quality, and are shown in Supplementary Fig. 23. Following this step, the guide overrepresentation was calculated between the bottom 20% and top 20% populations, representing the lowest phagocytosing and highest phagocytosing iMGLs. Full methodology has been previously published73.
Arrayed lentiviral screening
AOWH_2, HEGP_3 and KOLF2.1S lines from the HipSci repository (www.hipsci.org) were used for all CRISPR screening validation. Three TREM2 and three intergenic sgRNAs were cloned, produced, resazurin-titrated and pooled. Day 36, 40 and 46 precursors received 4 μg ml−1 polybrene under wild-type, VPX control, TREM2-virus or intergenic-virus conditions. The medium was replaced after 24 h, and 1 μg ml−1 puromycin was added on days 3 or 4, with half-changes on days 7 and 10. Day-14 TREM2/vinculin western blotting and 6 h pmChGIP SH-SY5Y flow cytometry were used to assess knockdown and phagocytosis, respectively.
TREM2 ASO knockdown
An overview of the ASO experiments is provided in Supplementary Fig. 22. TREM2-171, TREM2-192, Scramble 1 and Scramble 2 ASO sequences71 (Supplementary Table 16) were applied to KOLF2.1S precursors on day 7 at triplicate doses from 20 μM to 76.3 pM. Protein was collected on day 14. Half-maximal inhibitory concentration (IC50) and 90% inhibitory concentration (IC90) values were calculated in R using the drm() function from the drc package (v.3.0-1)78 (Supplementary Fig. 22). For validation experiments, the above protocol was repeated at the respective IC50 and IC90 doses for TREM2-171 and TREM2-192, with the scramble controls matching the respective IC doses for each TREM2-targeting ASO.
AOWH_2, HEGP_3 and KOLF2.1S were used as follows. Precursors from days 36, 40 and 46 were plated at 4.84 × 10⁵ cells per ml in 48-well plates. ASO was added on day 7, with half-medium changes on days 3 or 4 and day 10, and assays on day 14. TREM2/vinculin western blotting and 6 h pmChGIP SH-SY5Y flow cytometry were used to measure protein and phagocytosis relative to vehicle.
Genotype imputation and quality control
Genotyping array files from the HipSci (http://www.hipsci.org) and IPMAR projects19 were imputed using the genimpute pipeline eQTL Catalog79. Post-imputation quality control retained variants with imputation r2 > 0.4 and MAF > 0.01. Sex was imputed for donors with bcftools +guess-ploidy on X chromosome region 2,781,480–155,701,381.
Donor proportion deconvolution by WGS
We developed poodleR, an R library that uses WGS to measure each donor’s proportion within each pool. It requires that donors are genotyped, and then variants are subset to those that present variation across all donors per individual pool. See the Supplementary Note for more details.
We simulated WGS pools with known donor proportions sequenced at a variety of mean depths to estimate the performance of the method, sampling lines for each scenario 100 times. The absolute error (Supplementary Fig. 4a) compared real to estimated proportions. Relative error was calculated as abs((real proportion − estimated proportion) / real proportion) × 100 (Supplementary Fig. 4b). Relative accuracy was measured as 100 − relative error.
Estimation of cellular phenotypes
WGS from 243 donor iPSC lines (19–24 per pool) for 14–15 pooled experiments was generated for the cellular phenotypes (differentiation efficiency, migration or phagocytosis). poodleR donor proportions (Supplementary Table 6) were corrected by the nearest simulated absolute error. For the differentiation efficiency phenotype, log-fractions were calculated per line, pool and replicate as log(proportion at later stage / proportion at earlier stage) for macrophage precursors versus iPSCs, aged (day 46–109) versus young (day 28–36) macrophage precursors and microglia versus macrophage precursors (Supplementary Table 7) and then scaled per replicate.
For the phagocytosis phenotype, log-fractions were calculated per line, pool and replicate as log(proportion mCherry+ / proportion mCherry−), then scaled per replicate. For the migration phenotype, log-fractions were calculated as log(proportion bottom side of transwell / proportion top side of transwell) per line, pool and replicate in the C5a+ and C5a− conditions separately; then the C5a+ fractions were normalized to their C5a− fractions and scaled per replicate.
Association of cell line features with differentiation efficiency
We tested covariate effects on differentiation efficiency across iPSC-to-precursor, young-to-aged precursor and precursor-to-iMGL transitions using linear mixed models. Models included PluriTest pluripotency and novelty scores32, sex, pool, number of donors per pool and donors as a random intercept. To test for the donor effect, it was set to a fixed effect and pool to a random intercept. Precursor age and treatment were also tested for iMGL differentiation. Significance was assessed using drop1(test = “Chisq”) in R. Analyses included lines present in ≥2 pools (n = 73–89). Given that the differentiation score partially depends on that of the adjacent stage, multiple testing correction was not applied. IPMAR versus HipSci and AD versus healthy effects were tested separately by t-test because they were confounded with pool (n = 220–241).
Correlation between iPSC gene expression profiles and differentiation from iPSC to precursors
Bulk iPSC RNA-seq data from a previous publication80 that overlapped with the lines included in this study were correlated with precursor differentiation efficiency. Scores were adjusted for sex and PluriTest measures. Pearson correlations were tested using 1,000 permutations of residualized scores (Supplementary Table 17). Significant genes were analyzed with gProfiler81, using Bonferroni correction.
Correlation between iMGL and brain cell line differentiation
Using a previously published17 dataset, we derived a comparable metric of differentiation efficiency by calculating within-pool scaled log(day 52/day 11) donor proportions from their untreated cells (using their Supplementary Table 2). Proliferation was measured across all differentiated cells and within dopaminergic/serotonergic-like neurons. Their differentiation efficiency metric was centered and unit-scaled; Pearson r and P values were reported for all three comparisons.
Functional variant effect annotation of whole-exome sequencing
Whole-exome sequencing files from 226 lines were PASS-filtered as previously described28, and functional variant effects were annotated using the variant effect predictor82. Deleterious variants (69,223 variants across 16,348 genes) comprised frameshift, stop-gained, transcript ablation, splice acceptor or splice donor, or those annotated as missense, start-lost and protein-altering, which had CADD Phred scores over 15. All other missense variants were considered missense non-deleterious (‘missense’, 62,022 variants across 15,523 genes).
Test of deleterious and missense variant effects on cellular phenotypes
Gene-level missense and deleterious associations with line-level mean scaled phenotypes were tested using the sequence kernel association optimal test (SKAT-O)83, with skat84 in R. A total of 194, 178 and 197 lines were tested for iPSC-to-precursor, young-to-aged precursor and precursor-to-iMGL, respectively. Empirical P values used 1,000 null-residual bootstraps adjusted for sex, mean minimum donor proportion, genotype PCs one and two and, for phagocytosis or migration, differentiation efficiency of precursor-to-iMGL. For significant genes, variants were aggregated as previously described12, and burden betas were estimated by linear mixed model regression using lmerTest85 with the same covariates as for SKAT-O and including an (1|pool) term. For phagocytosis and migration, we used the following formula:
Scaled phenotype (phagocytosis or migration) ~ deleterious burden + sex + minimum line proportion in replicate + scaled differentiation + genotype PC1 + genotype PC2 + (1|pool).
For iPSC-to-precursor and young-to-aged precursor differentiation efficiency phenotype, we fitted the same formula without including differentiation efficiency as a covariate. For the effects on precursors-to-iMGL, the test was performed in the same way, including an additional (1|treatment) term. Bonferroni-significant genes were aggregated by beta direction and retested. Global burden was tested by aggregating all genes.
Area under the curve was calculated by building a binary classification of ‘dropouts’ or ‘takeovers’ for lines with a differentiation efficiency of >2 s.d. below or above the mean, respectively, and then testing the aggregated burden of deleterious variants in significant genes in the relevant direction as predictors.
Genes showing significant differentiation effects, previously identified using SKAT-O, were tested for enrichment among DepMap essential genes and macrophage survival genes from a previous publication31 (Supplementary Table 18), using Fisher’s exact test.
scRNA-seq processing and line identity deconvolution
FASTQ files were processed with 10x Genomics Cell Ranger86 using default parameters. scRNA-seq deconvolution was performed with Vireo87 and cellSNP-lite88 using default parameters.
A total of 3,404,020 cells were processed in Seurat (v.5.0.3)89 (Supplementary Table 19), filtering out low-quality cells (those with >10% mitochondrial genes, that presented a number of unique molecular identifier counts under the 5th percentile, doublets and cells with unassigned line identity; Supplementary Fig. 1a); 2,341,497 remained across all pools and treatments. Each pool–treatment combination was log-normalized, and the 2,000 most variable genes were selected for integration using a 5,000-cell ‘sketched’ subset generated with SketchData(), which samples without replacement while retaining rare cell types. On this subset, principal component analysis, shared nearest-neighbor construction, Louvain clustering and uniform manifold approximation and projection were performed. Pools were integrated using Harmony, and remaining cells were projected onto the integrated manifold.
Integrated uniform manifold approximation and projection plots were annotated using marker genes and previously published differential expression gene sets21 using Seurat’s AddModuleScore(). In parallel, each treatment was mapped to the integrated PCA reference from that publication21 using Seurat’s anchor-based reference mapping workflow. Transfer anchors were identified using shared genes and the first 30 PCs, labels were transferred with TransferData() and query cells were projected into the reference embedding using MapQuery(). Visualizations were generated with SCpubr90 and scCustomize91. Overrepresentation of donors within each cluster was tested with a Wilcoxon rank-sum test.
PRS calculations
PRS were calculated with PRSice-2 (ref. 92). We first excluded the APOE regions and then used the remaining regions of the AD GWAS summary statistics (from ref. 7), with LD from the subset of European-ancestry individuals from the 1000 Genomes Project (1000G EUR). As a non-default parameter, we set the P value threshold to 0.1. We then calculated the PRS for the 1000G EUR cohort for the variants shared with our sample. We adjusted the raw scores for five genotype PCs for both datasets, and scaled the HipSci and IPMAR line scores to those of the 1000G EUR cohort. We then added the scores for the APOE alleles with values B(APOE ε2) = −0.47, B(APOE ε3) = 0 and B(APOE ε4) = 1.12, as previously reported93, and scaled them to those of the 1000G EUR dataset. Finally, we added the scaled polygenic and APOE scores to obtain the full PRS. The distribution of the two PRS is shown in Supplementary Fig. 12a–c.
For microglia-specific PRS, ±250 kb regions around lead loci colocalizing between eQTLs and AD GWAS were selected per treatment and used as input to PRSice-2 for our 261 donors and 1000G EUR scaling data. All other scoring steps were unchanged. PRS distributions are shown in Supplementary Fig. 12e.
Differential expression across treatments
Raw unique molecular identifier counts from non-proliferative clusters were aggregated by line, pool and treatment replicate. Samples with fewer than 100 cells were excluded, leaving 194 lines, and genes were retained if they were detected at ≥1 counts per million (CPM) in at least 30% of donors (Supplementary Fig. 2a). Counts were transformed to log2(CPM) and analyzed with limma94 using voom() weights and duplicateCorrelation() to account for pool effects. The model was:
Gene expression ~ treatment + donor + log10(ncells)
Sex and age were omitted because they were confounded with donor, and age was incompletely recorded. Contrasts were tested for IFNγ-treated versus untreated, LPS-treated versus untreated and IFNγ-treated versus LPS-treated, with moderated t-statistics from eBayes() and Benjamini–Hochberg FDR correction. The log2(FC) in expression takes the second element in the contrast as the baseline; log2(FC) was defined relative to the second contrast group. Significant genes numbered 926 downregulated and 800 upregulated for IFNγ-treated versus untreated, 1,144 downregulated and 892 upregulated for LPS-treated versus untreated and 975 downregulated and 1,078 upregulated for IFNγ-treated versus LPS-treated.
Differential expression across PRS
Counts were aggregated, filtered, transformed and adjusted for pool effects as above. Within each treatment, we fitted:
Gene expression ~ PRS + sex + log10(ncells)
Age was excluded because of incomplete records and confounding with high PRS among IPMAR donors with AD. PRS coefficients represent log2(FC) per unit increase in PRS. At FDR < 0.05, 80 genes were downregulated and 63 upregulated in untreated cells, 24 downregulated and 32 upregulated in IFNγ-treated cells, and 7 downregulated and 14 upregulated in LPS-treated cells.
Empirical P values were obtained by permuting donor PRS values 100 times and comparing observed gene-level t-statistics with the permutation distribution.
Differential expression across phenotypes
Counts were aggregated and filtered as above. Replicate measurements of scaled migration and phagocytosis phenotypes were averaged, together with the minimum line proportion to account for increased variance in low-abundance lines. Analyses were performed separately by treatment using limma while accounting for pool effects:
Gene expression ~ scaled phenotype + sex + min. line proportion + genotype PC1 + genotype PC2.
Genes with FDR-adjusted P < 0.05 were considered significant. The log2(FC) represents the expression change per unit increase in the scaled phenotype.
Enrichment analysis in differential expression and eQTL results
Genes were ranked by treatment-specific differential expression t-statistics. Transcription factor and PROGENy pathway activities were inferred using decoupleR95 with CollecTRI ref. 96 and PROGENy ref. 97, respectively. MSigDB Hallmark pathways and candidate gene sets were tested with gene set enrichment analysis98 using msigdbr99 and fgsea100, with Bonferroni correction for gene sets and Benjamini–Hochberg correction for pathways. AD, PD, MS and ALS candidate gene sets were defined from Open Targets Genetics locus-to-gene scores (globalScore of ≥0.05). eQTL eGenes were tested for protein–protein interaction and Gene Ontology enrichment using STRINGdb101.
Filtering genotypes and lines for eQTL and phenotype association analysis
Genotype quality control included filtering out variants with imputation INFO < 0.7, Hardy–Weinberg equilibrium P < 10−6, >10% sample missingness or MAF < 5%, leaving 6,405,518 variants. The 1000 Genomes data were filtered similarly and used for joint PCA. One line from each clone pair and four donors not clustering near European populations were excluded (Supplementary Fig. 12d), leaving 250 donors for downstream analyses.
eQTL mapping
scRNA-seq counts from non-proliferative clusters were aggregated into donor-level pseudobulks, as treatment-specific subtypes were poorly defined and eQTL detection is strongly influenced by cell number25. Genes were retained if they were detected at ≥1 CPM in at least 30% of donors, then log-normalized and scaled. Pseudobulks with fewer than 100 cells, duplicate clones, donors without genotype data and donors without predicted European ancestry were excluded, leaving 188 donors for IFNγ and LPS and 189 untreated donors.
cis-eQTL mapping was performed with tensorQTL102 using variants within ±250 kb of each transcription start site, adjusting for two genotype PCs and 5–120 expression PCs. map_cis used 1,000 permutations to obtain empirical significance; eGenes with FDR < 0.05 were retained. Expression PC numbers maximizing eGene discovery were 63, 73 and 84 for untreated, IFNγ-treated and LPS-treated, respectively.
The degree of eQTL sharing was calculated by multivariate adaptive shrinkage with mashR103. Tested genes and gene–variant pairs were highly concordant across treatments, with pairwise Jaccard similarities of 0.93–0.94 (Supplementary Fig. 3b). Lead eQTL–eGene pairs were evaluated across treatments, and eQTLs were considered shared when the local false sign rate (lfsr) was <0.05 and posterior effects had the same sign and differed by less than 0.5.
GWAS of cellular phenotypes
Genotypes and lines were filtered as for eQTL analyses. To reduce false positives from repeated measurements and low-abundance donors, samples were retained only when the smaller donor fraction was ≥1%, then scaled phenotypes were averaged across pools and replicates. For phagocytosis, 133, 137 and 140 lines remained in untreated, IFNγ-treated and LPS-treated conditions; for migration, 147, 92 and 147; and for differentiation, 209, 229 and 230, respectively. Associations were tested by linear regression:
Mean phenotype ~ Alternative allele dosage + sex + number of pool replicates + genotype PC1-5.
Colocalization analysis of eQTLs and GWASs
External AD7, PD54, MS56 and ALS55 GWASs and our eQTL datasets were subset to loci in which significant lead eQTLs (FDR < 0.05) and GWAS variants (P < 5 × 10⁻⁸) occurred within 500 kb. Colocalization was performed on ≥50 shared variants using coloc104 under the single causal variant assumption. Default p1 and p2 priors were used, with p12 = 1 × 10⁻⁶. Loci with PP.H4 (‘both traits are associated and share a single causal variant’) of >70% were considered colocalized.
Locus plots were generated with locuszoomr105 using 1000 Genomes GRCh38 high-coverage LD from LDlink106. Colocalization with iMGL cellular phenotype associations was performed similarly using shared significant eQTL variants.
Fine mapping of TREM2 AD GWAS locus
Selected GWAS loci were fine-mapped with susieR107 using harmonized summary statistics and 1000 Genomes GRCh38 high-coverage LD from LDlink106. Non-default arguments for susie_rss() were: n = aggregate number of cases and controls in GWAS; L = 1; coverage = 0.60; min_abs_corr = 0.0.
Testing for enrichment in disease heritability near gene sets
Disease heritability enrichment was tested using stratified LDSC108 implemented with CELLECT109. Differential expression t-statistics were directionally separated and min–max scaled from 0–1, with opposite-sign genes set to zero. eGenes were similarly ranked using mashR scores (−log10(lfsr) × posterior mean) and scaled. CELLECT-LDSC then tested whether highly ranked genes were enriched for disease-associated heritability in each treatment.
TWMR analysis
TWMR40 was used to estimate causal effects of gene expression on microglial phenotypes. For each treatment-specific focus eGene, we selected the lead eQTL and top colocalizing variant, expanded to associated eGenes and significant eQTLs (P < 10−8), and pruned variants for LD (R2 < 0.2) and correlated eGenes (R2 ≤ 0.4). Phenotype GWAS effects were combined with eQTL effects using:
$$\hat{{\rm{\alpha }}}={\left({{\rm{E}}}^{{\prime} }{{\rm{C}}}^{-1}{\rm{E}}\right)}^{-1}\left({{\rm{E}}}^{{\prime} }{{\rm{C}}}^{-1}{\rm{G}}\right)$$
where E contains SNP–eGene effects, G represents phenotype GWAS effects and C is the LD matrix obtained from TOPMed EUR110 using TopLD111. Only genes with an F-statistic of >10 were retained to limit weak-instrument bias.
Association of PRS with microglial phenotype
Full and microglia-specific PRS were tested against microglial phenotypes by linear regression after phenotype processing as done for GWAS:
Mean phenotype ~ PRS + sex + number of pool replicates + average minimum donor proportion.
PRS terms included the full score, polygenic component or APOE component. Genotype PCs were omitted because PRS had already been PC-adjusted.
Reporting summary
Further information on research design is available in the Nature Portfolio Reporting Summary linked to this article.